Software bills are climbing fast and businesses are buying more tools than ever before. You might be surprised that global cloud application services revenue is forecast to hit $375.57 billion in 2026.
We gathered these fresh SaaS Statistics to help you track market valuation and AI adoption trends. Here are the numbers that matter.
From revenue benchmarks to vertical SaaS trends, get the data you need to make smarter decisions about your SaaS tools and technology stack investments.
Fun Fact: Organizations add new SaaS apps so fast that IT teams only track 60% of them. That hidden 40%? Pure shadow IT chaos.
Key SaaS Statistics at a Glance
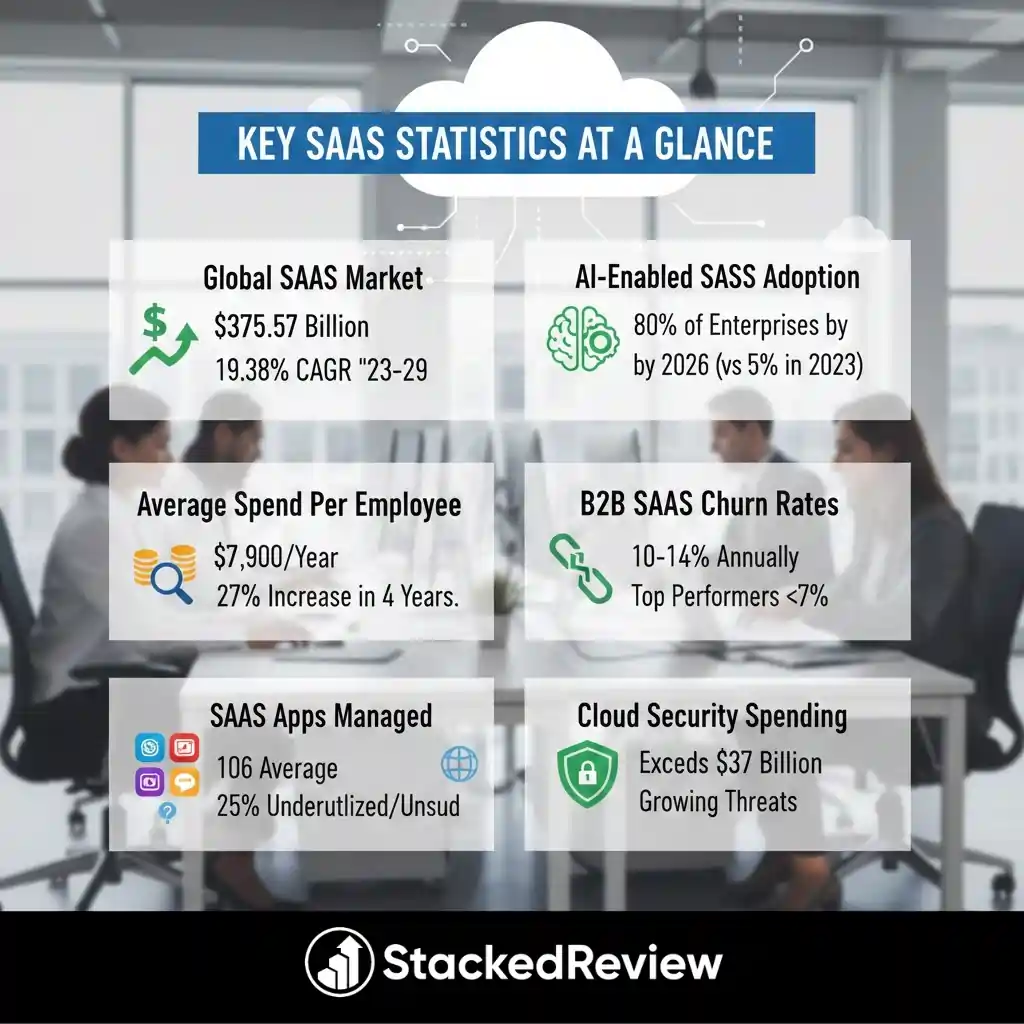
Global SaaS Market Size and Valuation
The SaaS industry growth trajectory continues to defy economic headwinds, driven by enterprise reliance on cloud-based solutions.
| Year | Market Valuation (Estimated) | Growth Rate |
|---|---|---|
| 2024 | $247.2 Billion | – |
| 2025 | $315.0 Billion | 27.4% |
| 2026 | $375.6 Billion | 19.2% |
| 2029 | $793.1 Billion | 19.3% (CAGR) |
| 2032 | $1.23 Trillion | 18.4% (CAGR) |
This sustained financial momentum confirms that the subscription economy remains the preferred model for modern business software procurement.
Enterprise SaaS Adoption: Apps Per Company And Growth
Organisations are refining their tech stacks, moving from unchecked accumulation to strategic SaaS portfolio management.
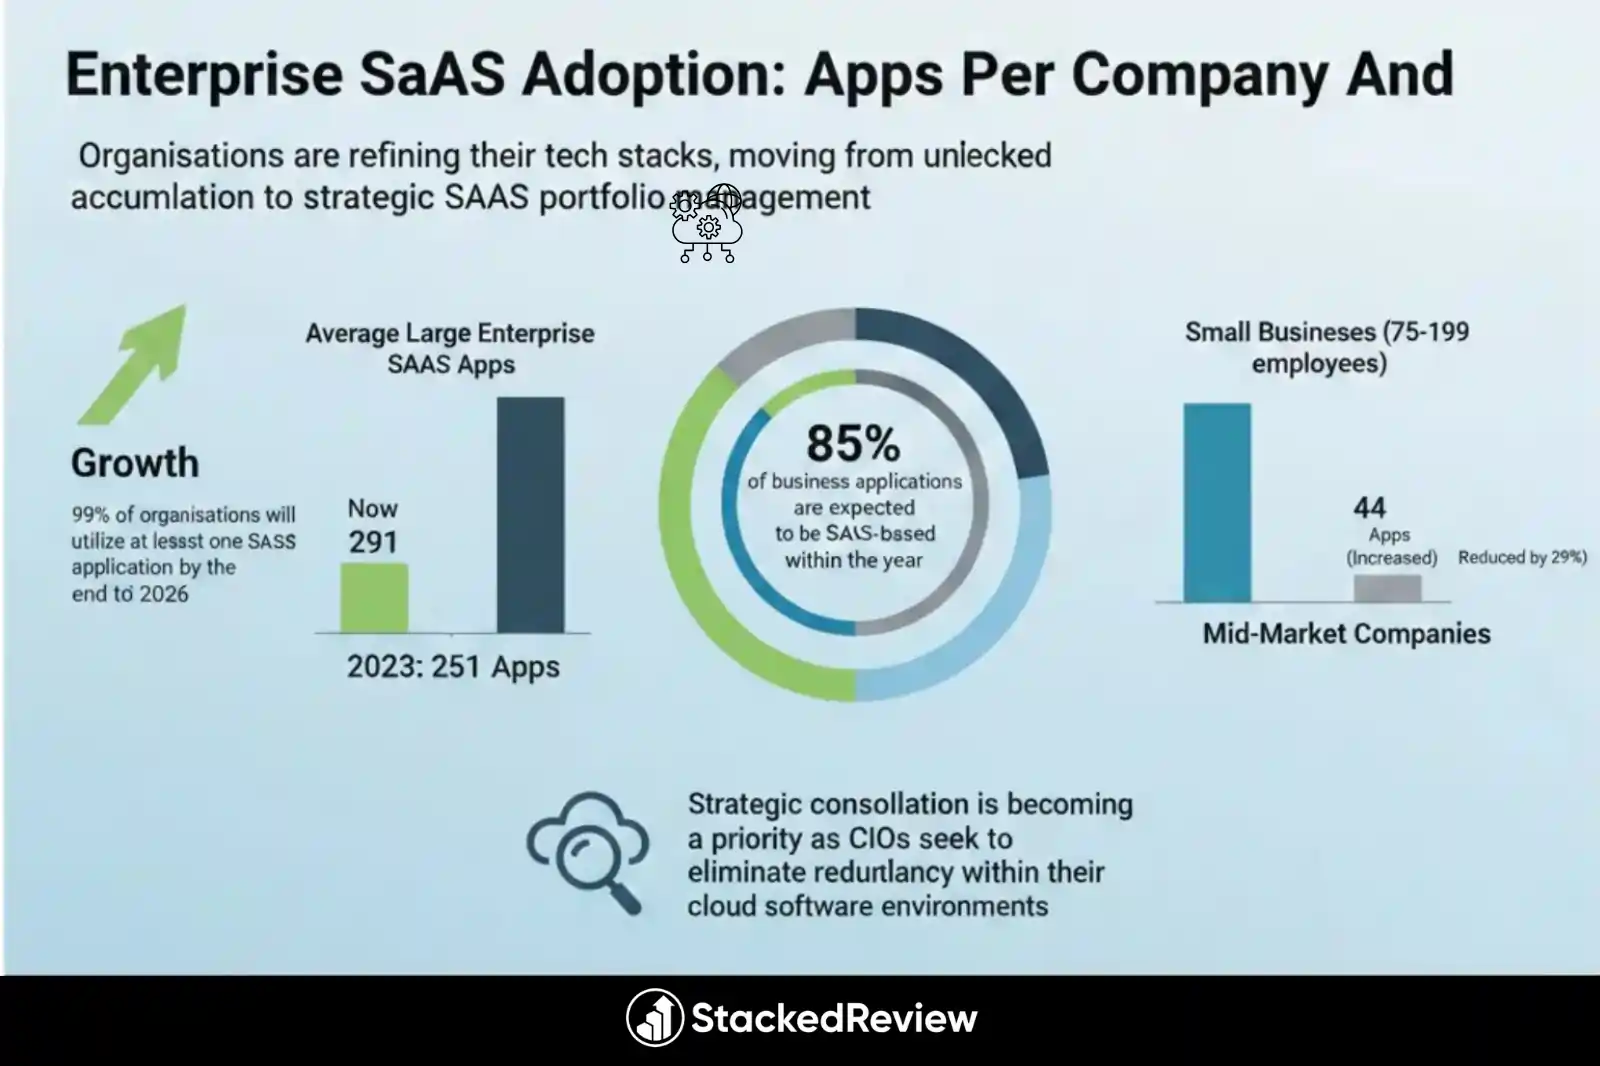
Strategic consolidation is becoming a priority as CIOs seek to eliminate redundancy within their cloud software environments.
AI In SaaS: Adoption, Savings, And Pricing Power
The integration of artificial intelligence is the single most significant driver of SaaS product innovation in 2026.
| Metric | Statistic | Impact |
|---|---|---|
| AI Adoption | 80% of companies | Widespread deployment of AI apps |
| GenAI Impact | $80 Billion savings | Cost reduction in customer service |
| Feature Usage | 7.3 Apps | Avg. AI-enabled apps per company |
| Service AI | 45% of leaders | Deploying AI for customer support |
The era of AI-native SaaS has arrived, forcing legacy providers to adapt or risk obsolescence.
SaaS Churn Benchmarks: Healthy Retention And Risk Zones
Customer retention metrics are the primary health indicator for subscription-based businesses in a competitive market.
Maintaining a net revenue retention (NRR) above 100% is now the standard target for investable SaaS platforms.
How Much Do Businesses Spend on SaaS in 2026
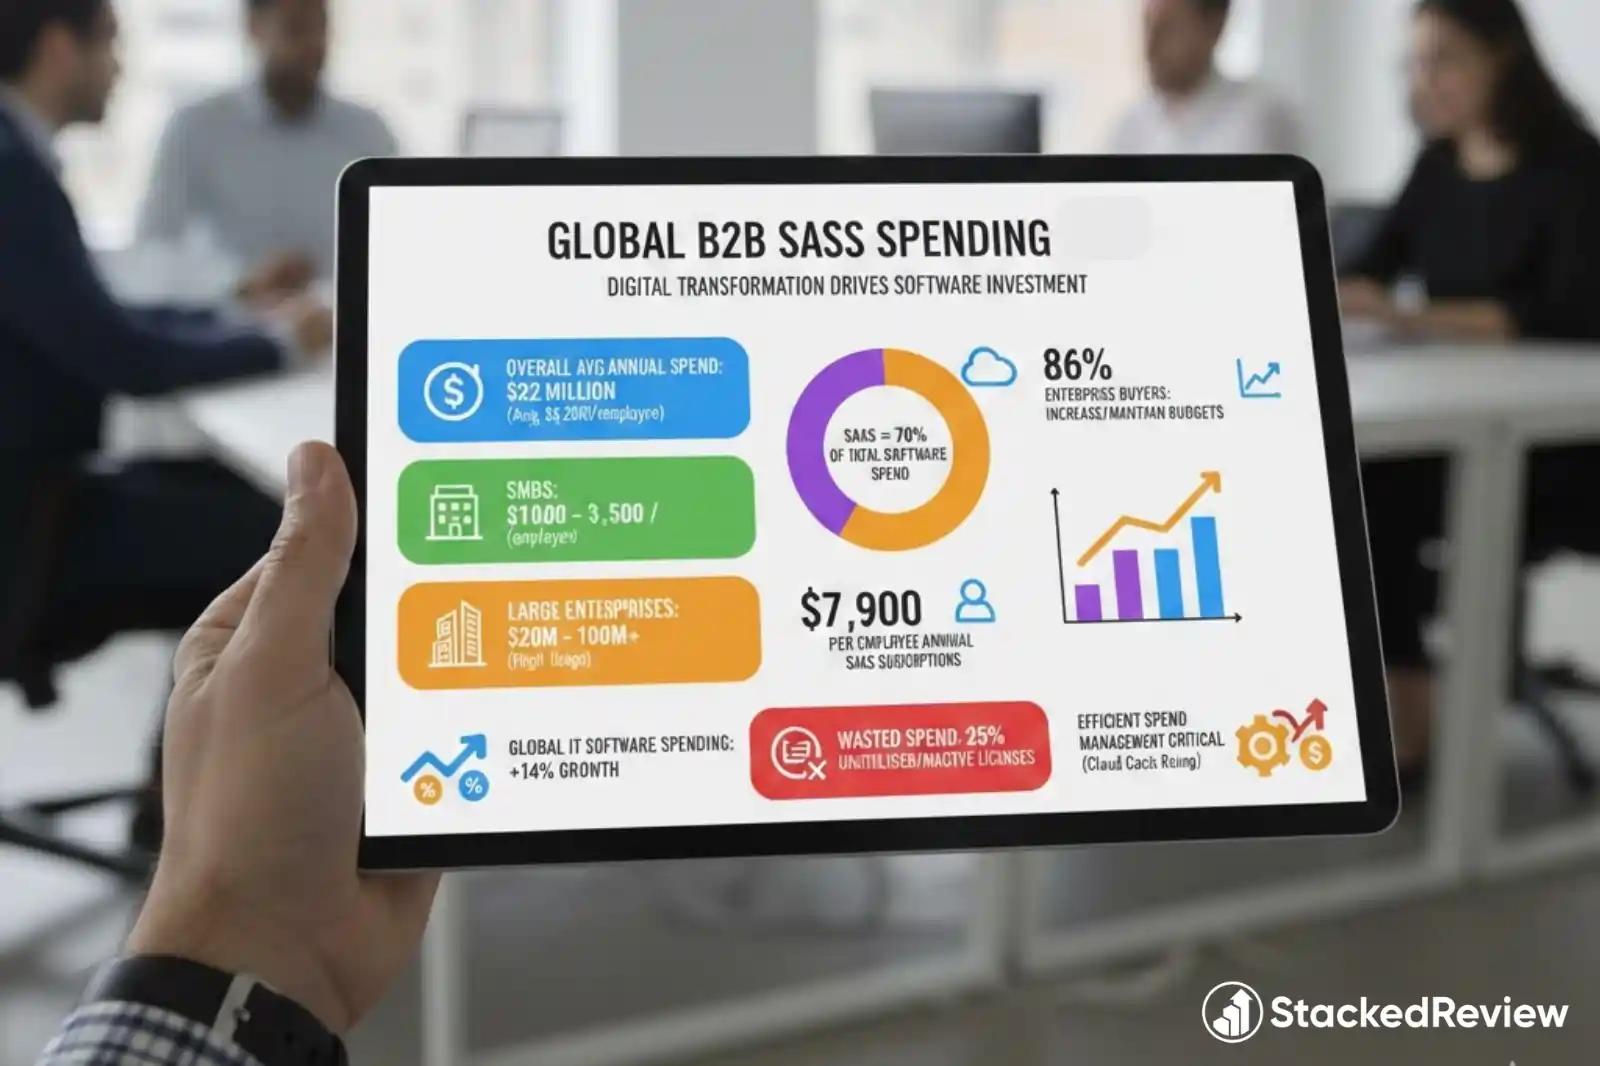
Corporate IT budgets are increasingly dominated by recurring software allocations as digital transformation matures.
| Company Size | Avg. Annual Spend | Spend Per Employee |
|---|---|---|
| Overall Avg | $52 Million | ~$4,200 |
| SMBs | Variable | ~$1,000 – $3,500 |
| Large Ent. | $20M – $100M+ | High intensity usage |
Efficient spend management is critical as the cost of cloud infrastructure continues to rise.
Vertical SaaS Growing 3X Faster Than Horizontal Solutions
Industry-specific software is outperforming generalist tools by offering tailored features for niche sectors.
- The Vertical SaaS market is projected to grow 2-3x faster than horizontal solutions in 2026.
- The Healthcare SaaS sector is expanding at an annual rate of 20%, driven by telemedicine and patient data needs.
- Retail and E-commerce SaaS is expected to reach $138.9 billion by 2027.
- BFSI (Banking, Financial Services, Insurance) SaaS adoption is growing at a CAGR of 19.2%.
- Construction and Agriculture are emerging as high-growth verticals for cloud adoption.
Specialised vertical cloud platforms are rapidly replacing generic legacy systems in highly regulated industries.
SaaS Marketing Spend, CAC Efficiency, And Growth Channels
Marketing spending in the SaaS world is shifting toward efficiency and high-intent channels. While growth is important, Customer Acquisition Cost (CAC) efficiency is now the primary lens for evaluating marketing budgets.
SaaS companies typically allocate 15-25% of their total budget to SEO and content marketing.
Effective SaaS marketing strategies in 2026 require a balanced mix of paid performance and long-term brand building.
Regional SaaS Trends: APAC and Beyond
While North America leads, the Asia-Pacific region is emerging as the next major engine for SaaS revenue.
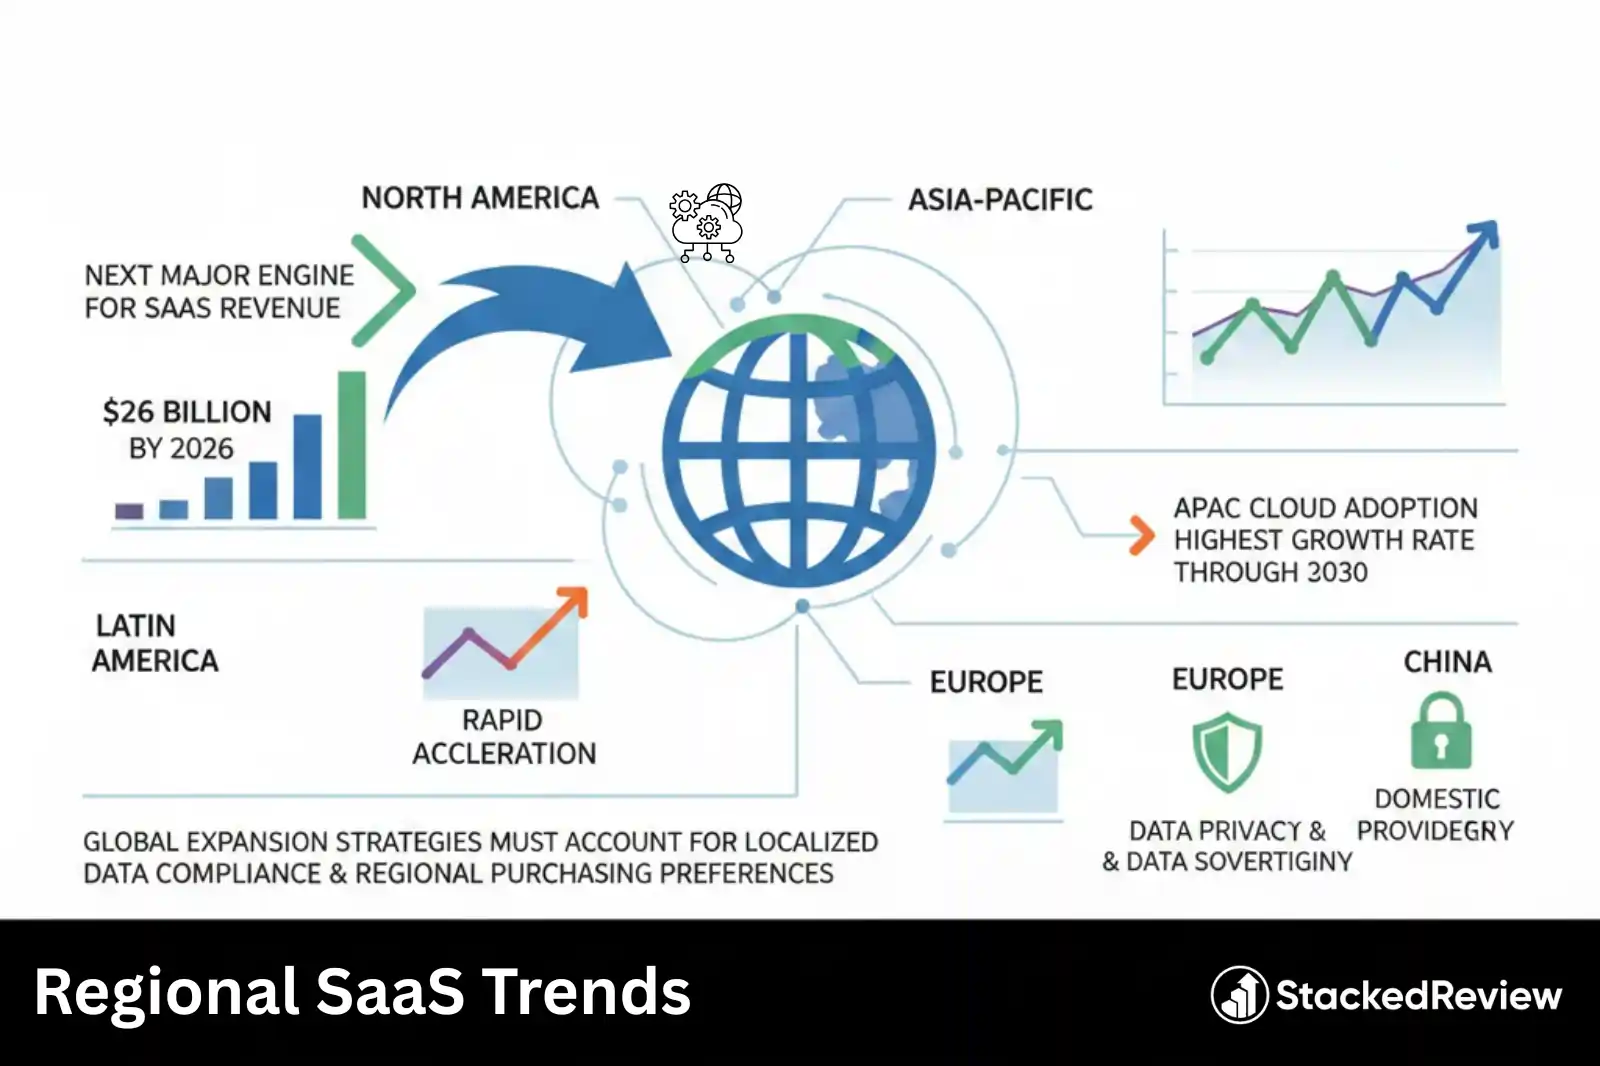
Global expansion strategies must now account for localised data compliance and regional purchasing preferences.
SaaS Security Threats and Shadow Application Statistics
Data security is the top concern for CIOs as decentralised app adoption creates new vulnerabilities.
Securing the SaaS supply chain is no longer optional but a mandatory requirement for enterprise resilience.
SaaS Pricing Models and Revenue Statistics
SaaS pricing strategies evolve rapidly as companies abandon flat subscriptions in favour of consumption-based models aligned with actual usage.
| Pricing Strategy | Implementation Rate |
|---|---|
| Sales-negotiated contracts | 44% |
| Fixed monthly/annual pricing | 34% |
| Variable usage-based pricing | 24% |
Usage-based pricing rewrites contract economics, with companies like Snowflake demonstrating success through credit-based consumption models.
Startup Success Rates and Venture Capital Funding Data
The SaaS startup ecosystem remains high-risk, but second-time founders see improved odds.
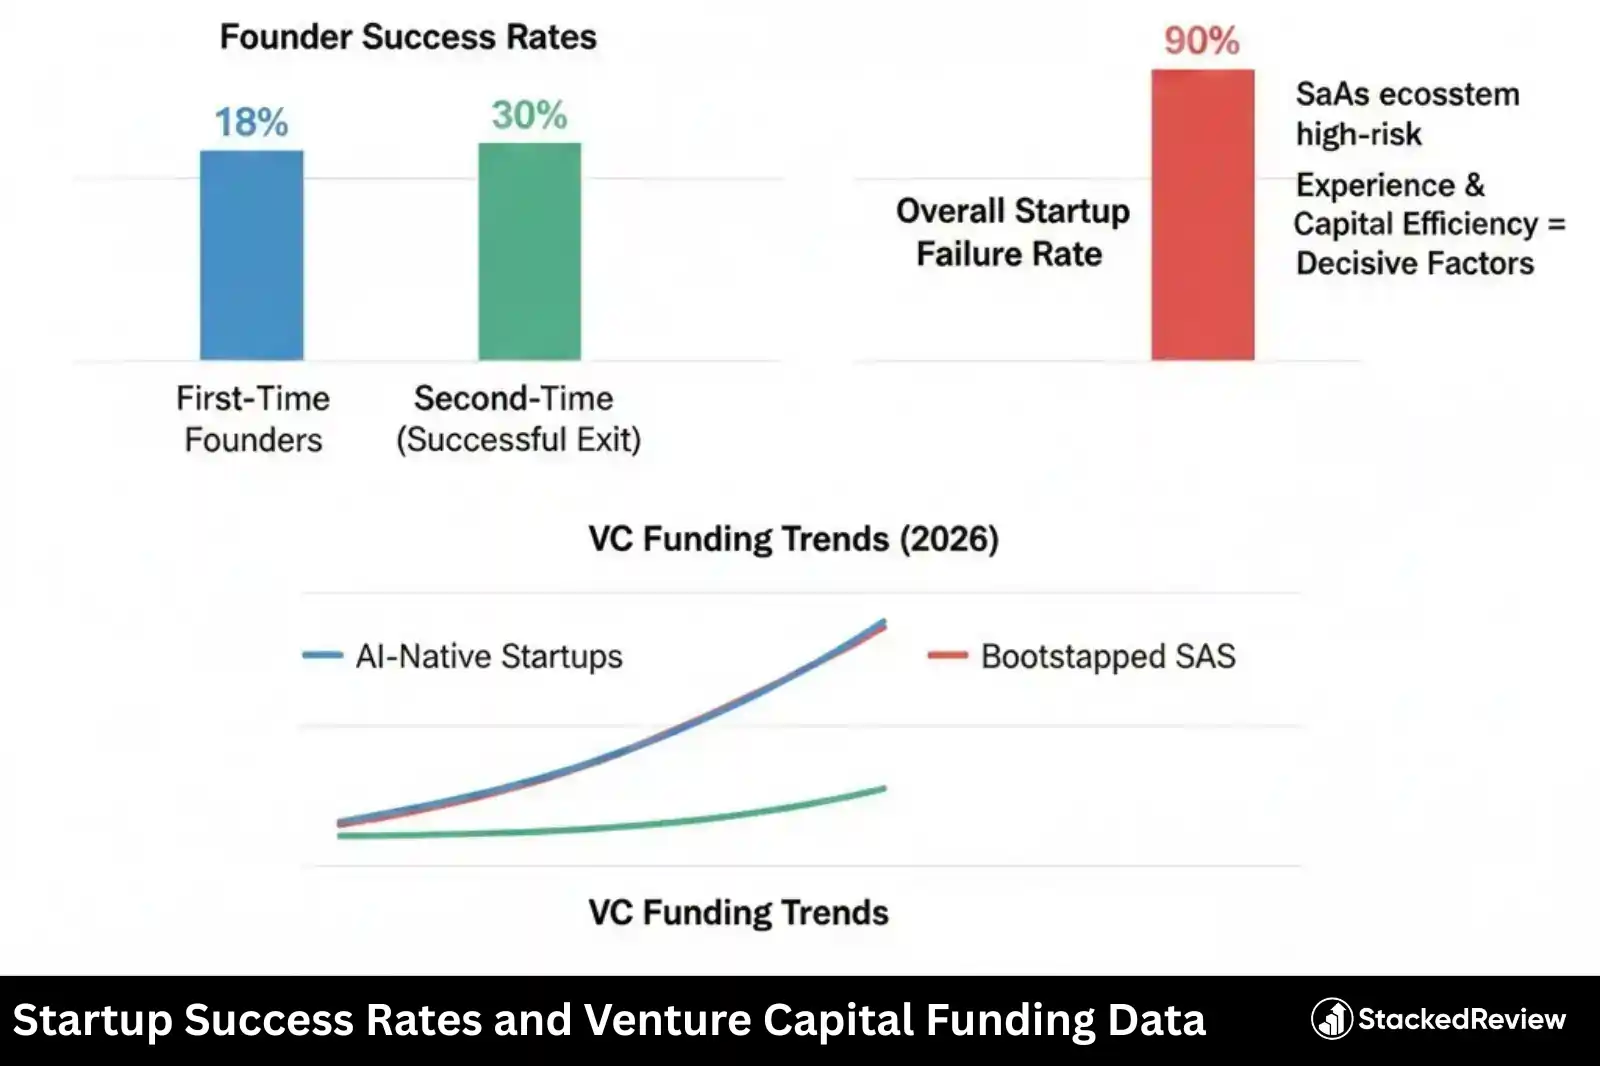
- First-time founders have a success rate of approximately 18%.
- Founders with a previous successful exit see their odds improve to 30% for their next venture.
- The general startup failure rate remains around 90% over the long term.
- Bootstrapped SaaS companies are gaining traction as VC funding becomes more selective.
- AI-native startups are attracting the majority of early-stage venture capital in 2026.
Experience and capital efficiency are proving to be the decisive factors for new entrants in the market
Emerging SaaS Trends: AI‑Native, Superapps, And iPaaS Growth
SaaS industry trends reshape software delivery through AI integration, platform consolidation, and outcome-based pricing.
Microservices architecture simplifies deployment and scaling, with the cloud microservices market expanding beyond 25% CAGR through 2026, adding $1.59 billion in market value.
Top SaaS Companies by Market Cap and Revenue
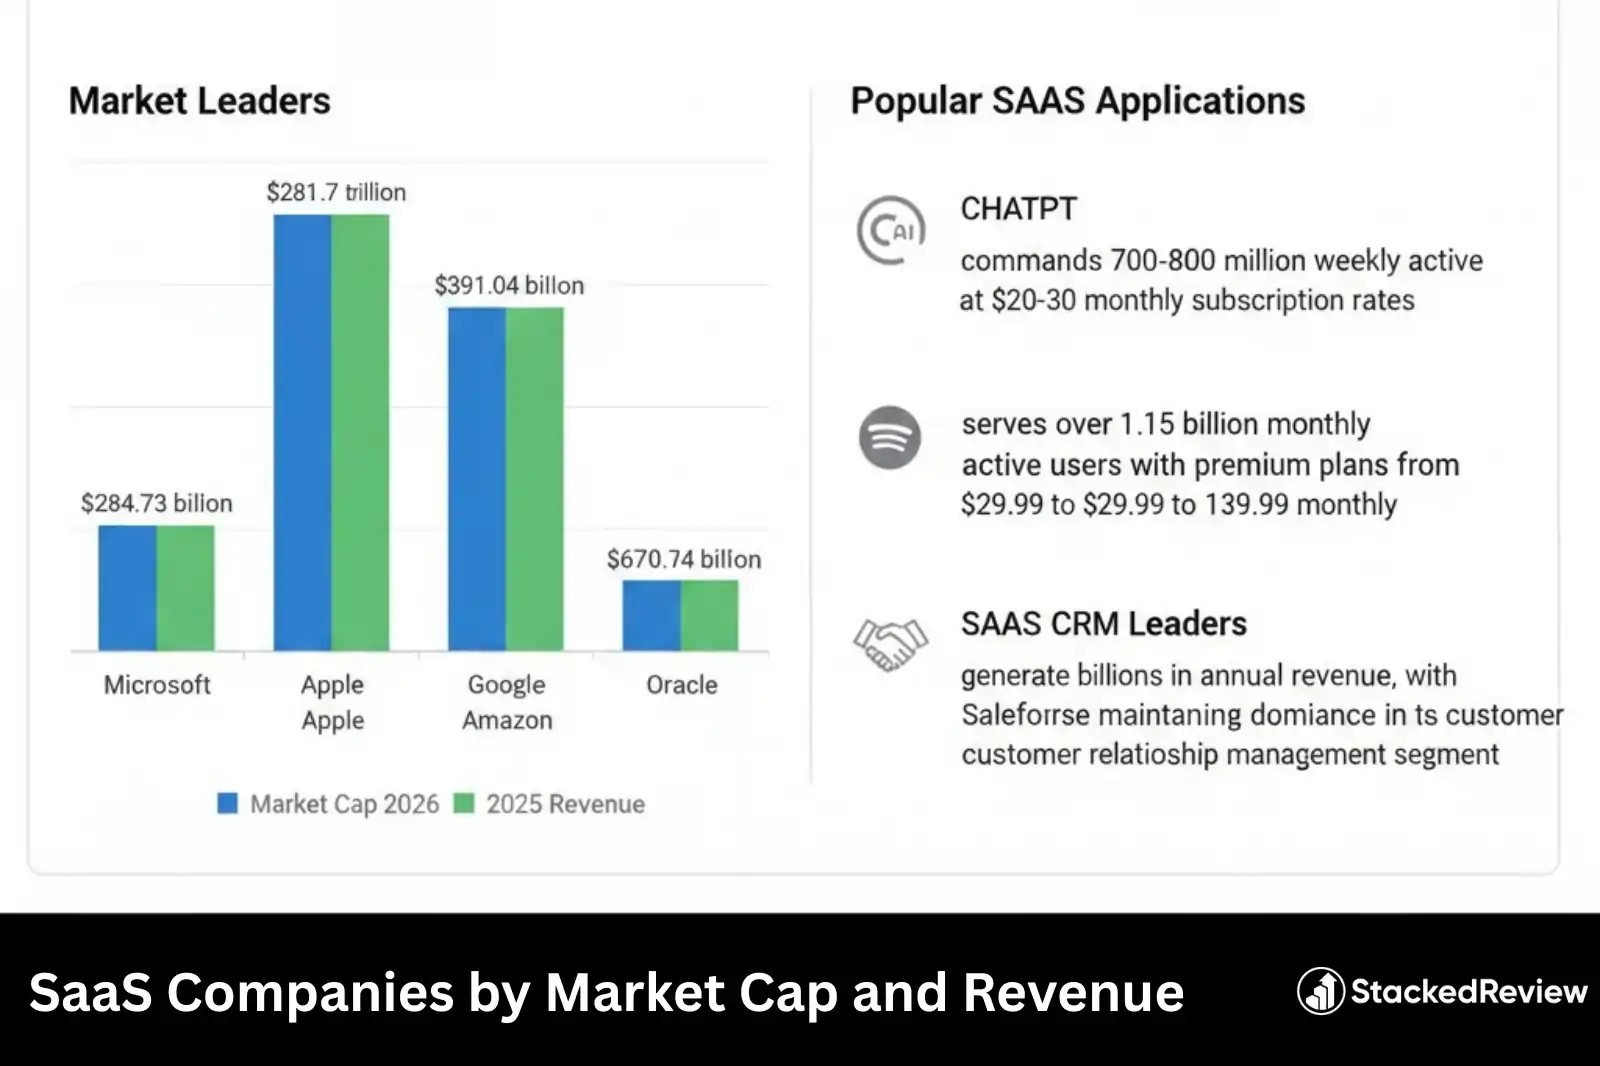
Market-leading SaaS vendors dominate market capitalisation, whilst emerging AI-native platforms capture growth segments.
Market leaders 2026:
| Company | Market Cap | 2025 Revenue |
|---|---|---|
| Microsoft | $3.85 trillion | $281.7 billion |
| Apple | $3.83 trillion | $391.04 billion |
| $2.97 trillion | $348.5 billion | |
| Amazon | $2.34 trillion | $670.04 billion |
| Oracle | $815.73 billion | $57.4 billion |
Popular SaaS applications:
SaaS CRM leaders generate billions in annual revenue, with Salesforce maintaining dominance in the customer relationship management segment.
Turning SaaS Benchmarks Into Actionable Growth Moves
SaaS Statistics for 2026 paint a clear picture. The market rockets toward $1 trillion by 2032 while 80% of enterprises now run Generative AI applications.
From AI automation cutting support costs by double digit percentages to flexible revenue models boosting recurring income, the next wave of SaaS growth rewards brands that track the right metrics and trim wasted spend.
These SaaS trends, benchmarks, and forecasts now sit in your hands so the only question left is how fast you act on them?