SEO Industry Statistics SaaS Marketers Can’t Ignore (2026)

By :
Jaclyn Donaldson
May 14, 2026
The SEO industry is worth $108.28 billion in 2026, and it shows no signs of slowing down. Businesses worldwide are pouring money into search engine optimisation to stay visible across Google, AI-powered search, and mobile platforms.
Organic search still drives 53.3% of all website traffic. Google processes 8.5 billion searches every single day. For SaaS marketers, these numbers are not just interesting. They are budget-shaping.
At StackedReview, we track SEO data closely because it directly impacts how software products get found online. Here are the most up-to-date SEO industry statistics for 2026.
SEO Industry Statistics: How Big Is the SEO Market?
The global SEO services market hit $108.28 billion in 2026. That is a 32.9% jump from $81.46 billion in 2024.
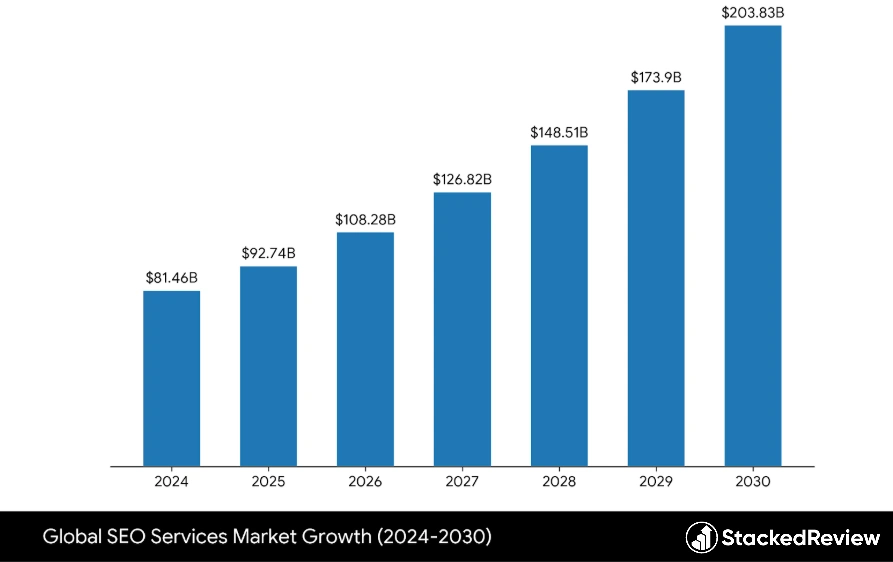
North America accounts for $31.4 billion, or 33.90% of global SEO revenue. The Asia-Pacific region is growing fastest, with a projected CAGR of 13.55% between 2026 and 2031.
| Year | Estimated SEO Market Size |
|---|---|
| 2024 | $81.46 billion |
| 2025 | $92.74 billion |
| 2026 | $108.28 billion |
| 2027 | $126.82 billion |
| 2028 | $148.51 billion |
| 2029 | $173.9 billion |
| 2030 | $203.83 billion |
By 2030, SEO services will surpass $203 billion globally. That is nearly double today’s figure.
For SaaS marketers, this growth means competition for organic visibility is intensifying. At StackedReview, we have seen first-hand how SaaS brands that invest early in SEO consistently outperform those relying solely on paid channels.
Search advertising spending is expected to reach $483.5 billion by 2029, growing at a CAGR of 8.86%. Google alone will capture over 70% of U.S. traditional search ad spending in 2026.
Google Search Statistics That Still Matter
Google is not going anywhere. Not in 2026. Not anytime soon.
Google holds 89.9% of global search engine market share. On mobile, it commands 95% of all searches.
| Search Engine | Global Market Share |
|---|---|
| 89.9% | |
| Bing | 10.51% |
| Yahoo | 2.67% |
| Yandex | 2.42% |
| DuckDuckGo | 0.60% |
| Baidu | 0.53% |
For SaaS brands, Google is still where buyers start their research. Ignoring organic search means ignoring the single largest source of web traffic.
Organic Search and Click-Through Rate Stats
Organic search drives 53.3% of all website traffic. That makes it the number one traffic source for most websites.
But where you rank on page one makes a massive difference.
Zero-click searches are rising too. About 60% of Google searches now result in no click at all. Users get their answers directly from featured snippets, knowledge panels, and AI Overviews.
For SaaS marketers, this means ranking in the top three is not a bonus. It is a requirement. Anything below position five gets minimal visibility.
We have noticed that SaaS tools with strong on-page SEO and well-structured content consistently capture featured snippet positions, which drives significant brand visibility even in zero-click scenarios.
SEO ROI Statistics by Industry
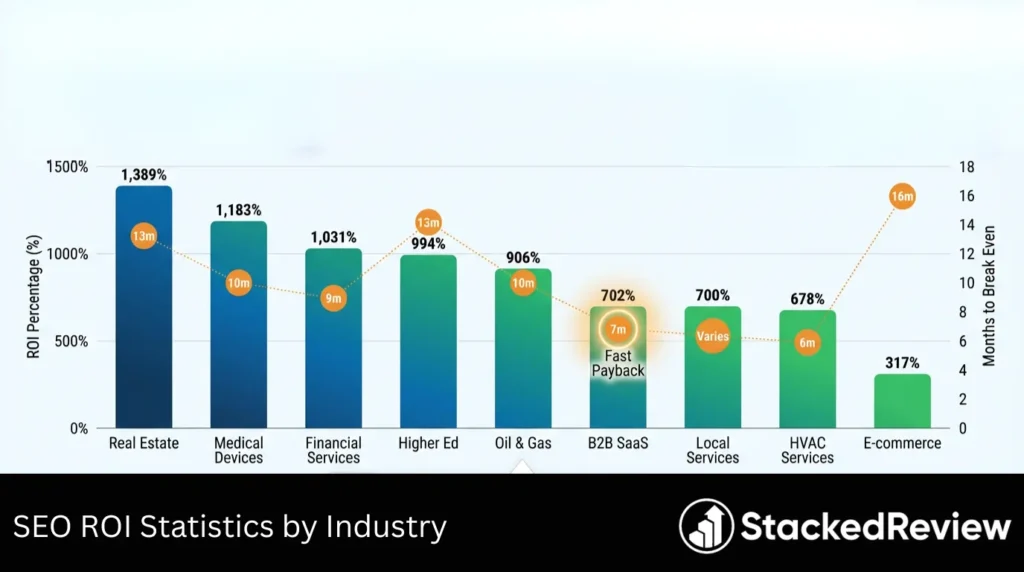
SEO delivers serious returns. On average, businesses earn $22 for every $1 spent on search engine optimization.
The median ROI across industries is 748%. Organic search generates leads at $31 per conversion, which is 84% lower than the $198 industry average through other channels.
| Sector | SEO ROI | Months to Break Even |
|---|---|---|
| Real Estate | 1,389% | 13 months |
| Medical Devices | 1,183% | 10 months |
| Financial Services | 1,031% | 9 months |
| Higher Education | 994% | 13 months |
| Oil & Gas | 906% | 10 months |
| Local Services | 700% | Varies |
| B2B SaaS | 702% | 7 months |
| HVAC Services | 678% | 6 months |
| E-commerce | 317% | 16 months |
B2B SaaS sees a 702% ROI with a 7-month breakeven period. That is one of the fastest payback timelines across all sectors.
70% of marketers say SEO generates more sales than PPC advertising. It takes 6 to 12 months to see positive ROI from an SEO campaign, with peak results typically in year two or three.
AI Overviews and Their Impact on SEO
AI is changing how search works. And it is happening fast.
Google AI Overviews now appear in approximately 60% of U.S. search queries. When an AI Overview shows up, organic CTR drops from 1.76% to just 0.61%.
Paid ads suffer too. CTR crashes from 19.7% to 6.34% when an AI Overview is present.
The Generative Engine Optimisation (GEO) services market was valued at $886 million in 2024 and is projected to reach $7.32 billion by 2031, growing at a 34% CAGR.
For SaaS marketers, this is critical. Your content needs to be structured so AI systems can cite it. At StackedReview, we are already seeing SaaS brands invest in AI answer engine optimisation alongside traditional SEO.
Among companies with 200+ employees, 83% reported improvements in SEO performance since they started using AI tools.
SEO Market Breakdown by Service Sector
Not all SEO spending goes to the same place. Here is how the market splits by service type:
| SEO Sector | Market Size (2026) | Projected Size (2030) |
|---|---|---|
| Content Creation | $41.2 billion | $69.79 billion |
| Link Building | $30.32 billion | $57.07 billion |
| Technical SEO | $27.07 billion | $50.96 billion |
Content creation is the largest SEO sector. It makes sense. Google rewards high-quality, original content above all else.
According to a Statista survey, 13.5% of SEO professionals named content strategy and production as their number one focus area. Data analysis came second at 9.6%.
Link building commands 28% of SEO budgets. And 79.7% of SEO professionals believe link building is critical to their strategy. The average cost of a paid link is $83.
Technical SEO receives roughly 25% of budgets. With Google’s mobile-first indexing now fully in place, site speed, mobile UX, and structured data are non-negotiable.
Mobile SEO Statistics for 2026
Mobile is not a secondary channel. It is the primary one.
Google announced in 2024 that it exclusively crawls and indexes all sites using its mobile Googlebot. If your SaaS website is not fully optimised for mobile, you are invisible to Google’s crawler.
At StackedReview, we test every SaaS tool we review on mobile first. Page speed and mobile UX directly influence organic rankings.
Local SEO Statistics That Drive Real Visits
Local search is a powerhouse. And it converts fast.
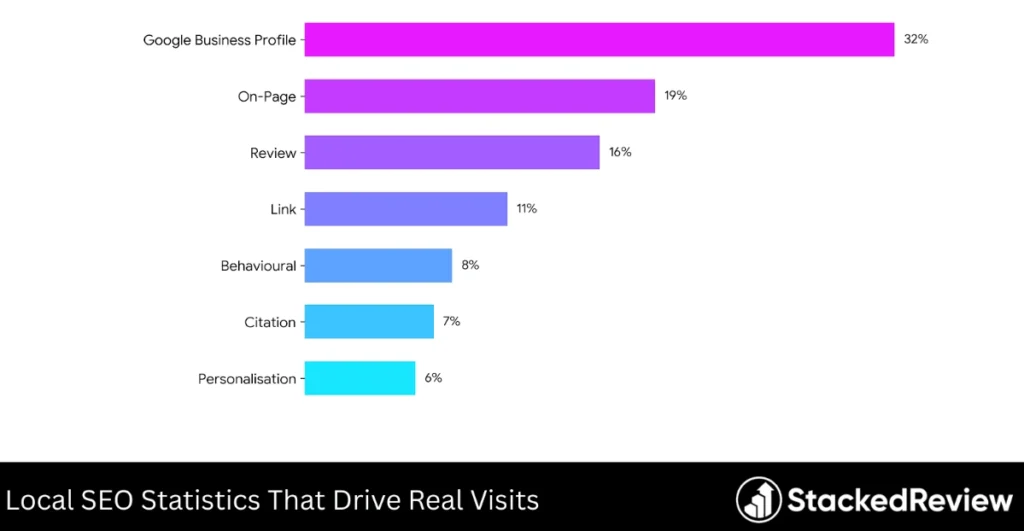
Here are the ranking factors for Google Local Pack results:
| Ranking Signal | Weighting |
|---|---|
| Google Business Profile Signals | 32% |
| On-Page Signals | 19% |
| Review Signals | 16% |
| Link Signals | 11% |
| Behavioural Signals | 8% |
| Citation Signals | 7% |
| Personalisation | 6% |
Reviews matter enormously. 88% of consumers say they would use a business that replies to all reviews. Only 47% would use one that never responds.
For SaaS companies targeting local or regional markets, optimising Google Business Profile listings and collecting genuine reviews is a low-cost, high-impact strategy.
Keyword Research and Search Intent Stats
Understanding search intent is the backbone of effective SEO.
Long-tail keywords are where smart SaaS marketers win. They carry higher purchase intent and face less competition.
96.55% of content on the internet receives zero traffic from Google. That means most pages fail because they target the wrong keywords or lack quality.
At StackedReview, we focus on long-tail keyword strategies when reviewing SaaS tools. Specific, intent-driven queries convert far better than generic head terms.
Content Marketing and SEO Performance
Content is still king. But only if it is genuinely useful.
Google rewards originality and depth. Keyword stuffing is dead. Information gain and unique insights are what move the needle now.
By 2027, the global content marketing industry is projected to grow by over $584 billion. That signals a massive shift toward content-led growth strategies.
Voice and Visual Search Statistics
Voice search optimization is growing faster than many marketers realise.
The voice and visual search segment is projected to expand at a 20% CAGR through 2030. That outpaces every other SEO service category.
This is a huge gap for SaaS marketers. Only 13% are optimising for voice, yet 41% of adults use it daily. Early movers will capture disproportionate traffic.
Technical SEO Statistics Worth Knowing
Technical health directly affects rankings. And many sites still get the basics wrong.
Structured data adoption varies widely. Among sites that use it, 67.7% use Open Graph, 52.4% use Twitter Cards, and 49.7% use JSON-LD.
For SaaS websites, technical SEO audits should happen at least quarterly. Broken links, missing schema markup, and slow page speeds silently drain organic traffic.
SEO Market Breakdown by Region
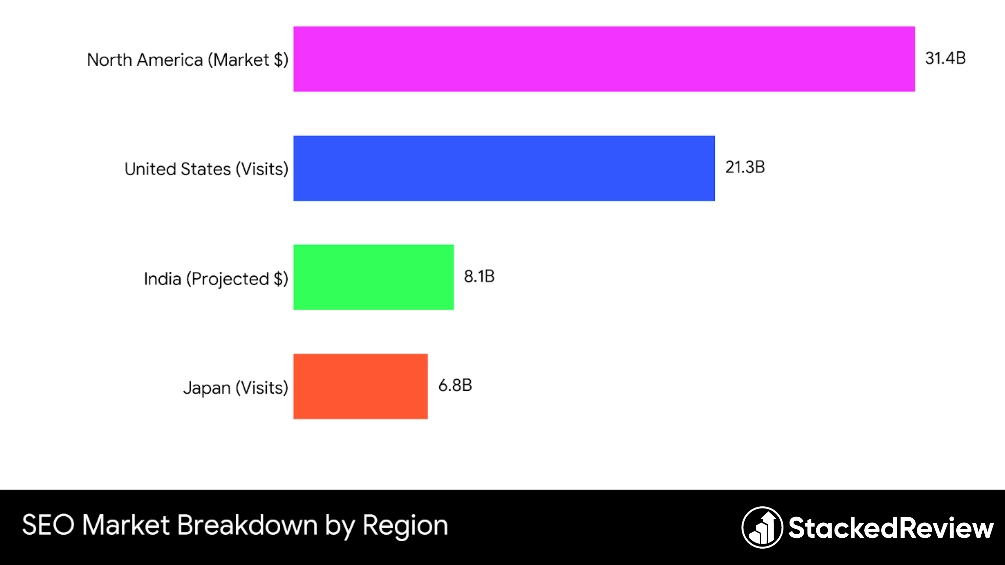
SEO investment varies significantly by geography.
| Region | Key Data |
|---|---|
| North America | $31.4 billion, 33.90% of global SEO market |
| Asia-Pacific | Fastest growth, 13.55% CAGR through 2031 |
| India | SEO software market projected at $8.1 billion by 2030, 18.2% CAGR |
| United States | 21.3 billion monthly Google visits, 20.98% of global traffic |
| Japan | 6.8 billion monthly Google visits, 6.68% of traffic |
India shows the highest growth rate of any country globally at 18.2% CAGR. For SaaS companies expanding internationally, India and Southeast Asia represent the fastest-growing SEO markets.
The U.S. leads with 21.3 billion monthly visits to Google, representing nearly 21% of all global Google traffic.
Social Media and SEO Crossover Stats
Social platforms are becoming search engines in their own right.
| Platform | % of All U.S. Referral Traffic |
|---|---|
| 3.62% | |
| YouTube | 3.48% |
| 3.15% | |
| X (Twitter) | 1.22% |
| 0.76% | |
| 0.61% |
Reddit’s organic search traffic has grown 603.41% since June 2023. Google actively ranks Reddit and Quora content higher, especially for informational and community-based queries.
50% of consumers now find new products on social media, and social commerce purchases increased 4x over the past two years.
YouTube is the second-largest search engine globally. Video content is 53 times more likely to generate organic search rankings compared to plain text.
What These SEO Stats Mean for SaaS Marketers
At StackedReview, we have spent years reviewing SaaS tools and tracking how organic search performance impacts product visibility.
Here is what stands out from the 2026 data:
The SEO industry is heading toward $203 billion by 2030. Competition will only grow. SaaS marketers who invest in organic search now will build a compounding advantage that paid channels simply cannot replicate.
Affiliate Disclosure: This post may contain some affiliate links, which means we may receive a commission if you purchase something that we recommend at no additional cost for you (none whatsoever!)
Similar Posts


Verification process
Editorial standards
We’re a team of real users — not bots, not press-release copiers. Here’s exactly how we earn your trust on every single post.
We Actually Buy the Products
Every deal on this site is tested with a real purchase using our own accounts. We don’t rely on screenshots sent by vendors or press kits. If we say the discount works, we’ve clicked through checkout ourselves.
No Pay-to-Rank Policy
We never accept payment to feature or rank a deal higher. Affiliate commissions don’t influence our editorial scores — a bad deal stays ranked low regardless of commission size.
Monthly Re-Verification
Pricing changes fast. Our team re-tests every published deal at least once a month and immediately updates or removes any that have expired, changed, or been capped.
Expert Editorial Team
Our writers and editors have collectively spent 40,000+ hours hands-on with digital tools. We know what a fair price looks like — and we call out bad deals even when they’d earn us commissions.
Transparent Scoring Criteria
Every score is calculated from a public rubric: discount value, feature-to-price ratio, redemption ease, plan flexibility, and competitor comparison. No hidden weighting, ever.
Reader Feedback Loop
Thousands of readers report broken deals each month. Our team investigates every report within 24 hours and updates the page the same day a deal stops working.
Jaclyn Donaldson
Jaclyn is a content strategist at StackedReview with a passion for empowering small businesses. She specializes in dissecting social media advertising costs and hunting down the best-value deals. Her goal is to help brands stretch their budget further without compromising on results.