
SaaS Retention Rate Statistics: 2026 Data and Projections

By :
Jaclyn Donaldson
July 21, 2026

In 2026 the median B2B SaaS company holds roughly 88 to 90 per cent of its revenue year on year. Net revenue retention lands near 106 to 110 per cent for most. Sounds healthy? The average business still loses about one customer in ten.
We have spent years pulling apart SaaS tools at StackedReview, and retention is the first number we check on any product.
These SaaS Retention Rate Statistics show you the benchmarks that predict growth, the churn traps that quietly drain ARR, and our own calls on where the figures move next. No fluff. Only numbers worth acting on.
SaaS Retention Rate Statistics 2026 at a Glance
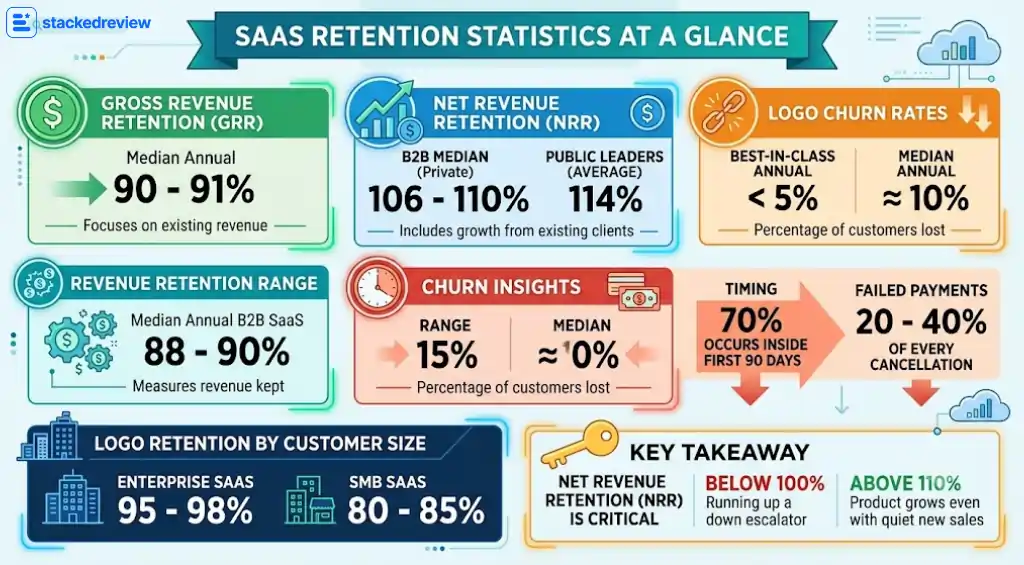
We pulled the headline numbers into one place so you can scan them in ten seconds. Every figure below reflects 2026 data, not recycled stats from three years ago.
StackedReview read: One number rules them all in 2026, and it is net revenue retention. If yours sits above 110 per cent, your product grows even when new sales go quiet. Below 100 per cent, you are running up a down escalator.
What Counts As a Good SaaS Retention Rate in 2026
Retention is not one metric. It is three, and mixing them up is the fastest way to fool yourself. Here is how we separate them at StackedReview.
Customer retention rate counts the raw number of accounts you keep. Lose 8 of 100 and you sit at 92 per cent. Simple, but it treats a £50 account and a £50,000 account as equals.
Gross revenue retention rate measures the money you keep before any upsell. It can never beat 100 per cent. Think of it as how leaky the bucket is.
Net revenue retention rate adds expansion back in. Upsells, seat growth and usage can push it past 100 per cent. This is the water level rising despite the leaks.
Read your own number against the right band. A 102 per cent net figure is strong for a small business tool and weak for an enterprise platform.
| Retention band | Gross revenue retention | Net revenue retention | Our verdict |
|---|---|---|---|
| Elite | 93%+ | 120%+ | Rare air, premium valuation |
| Great | 90-93% | 110-120% | Investable, compounding growth |
| Good | 85-90% | 104-110% | Healthy, room to expand |
| Median | 82-88% | 100-104% | At benchmark, watch the leaks |
| Warning | Below 82% | Below 100% | Base is shrinking, fix now |
The bands above are our own calibration from the 2026 data we track. We built them to give you a gut check in under a minute.
Net Revenue Retention Benchmarks by Segment and Deal Size
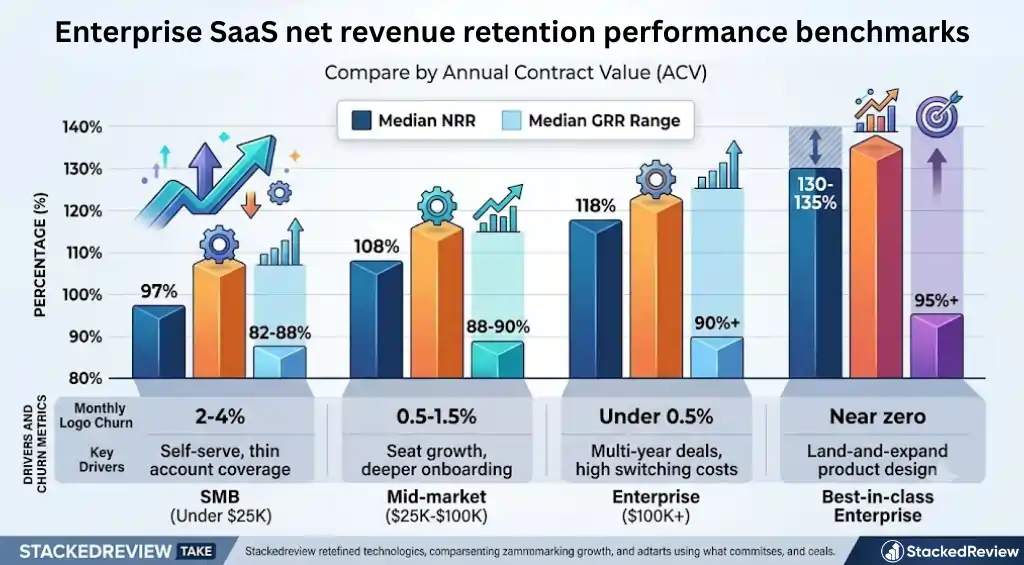
Segment changes everything. A rate that thrills an SMB founder would worry an enterprise team. The gap between the two ends of the market runs about 21 points in 2026.
Here is how the median splits by annual contract value.
| Segment (by ACV) | Median NRR | Median GRR | Monthly logo churn | What drives it |
|---|---|---|---|---|
| SMB (under $25K) | 97% | 82-88% | 2-4% | Self-serve, thin account coverage |
| Mid-market ($25K-$100K) | 108% | 88-90% | 0.5-1.5% | Seat growth, deeper onboarding |
| Enterprise ($100K+) | 118% | 90%+ | Under 0.5% | Multi-year deals, high switching costs |
| Best-in-class enterprise | 130-135% | 95%+ | Near zero | Land-and-expand product design |
SMB at 97 per cent net retention is not a failure. It reflects the reality of the segment. Small customers churn more and expand less. Holding 100 per cent at SMB scale is genuinely good, and 120 per cent there is exceptional.
Enterprise plays a different game. At that end, 120 per cent is merely the top tier, and the leaders push past 130 per cent through seats, modules and usage-based upgrades.
StackedReview take: Stop chasing the blended headline number. Start from your ACV tier’s median, add around 20 points of headroom if you price on usage, and subtract if you charge flat monthly. That single move turns a borrowed benchmark into a target you can actually hit.
Logo Churn and Monthly Churn Rates That Matter
Logo churn is the number most founders search for. Buyers convert it straight into annual risk. A 3 per cent monthly figure sounds tidy until you realise it wipes out roughly 30 per cent of your logos in a year.
The healthy monthly logo churn rate in 2026 varies by segment.
Stage matters just as much as size. Early companies leak far more than scaled ones, and investors judge the direction of travel rather than the raw seed-stage figure.
| Company stage | ARR range | Monthly customer churn | Annual logo retention |
|---|---|---|---|
| Seed | Under $1M | 3-5% | 80-85% |
| Early growth | $1M-$8M | 3.9% | 86-90% |
| Scale | $8M-$15M | 3.1% | 90-94% |
| Large scale | $15M+ | 1.8% net MRR churn | 95-98% |
Notice the jump between seed and growth. The biggest single improvement in the whole lifecycle tends to arrive when a company hires its first dedicated customer success teams. Monthly churn often falls from around 5.7 per cent to 3.9 per cent at that exact moment.
One more figure we watch closely: involuntary churn. Failed cards and expired payment details cause 20 to 40 per cent of all cancellations. A decent dunning sequence recovers 30 to 70 per cent of those charges with zero product changes. That is free money most teams ignore.
StackedReview reality check: The two quickest wins in retention are boring and highly profitable. Fix failed-payment churn with smart dunning, then nudge monthly customers onto annual plans. Both recover revenue already sitting on your books, no rebuild required.
SaaS Retention by Vertical: Who Sticks and Who Leaks
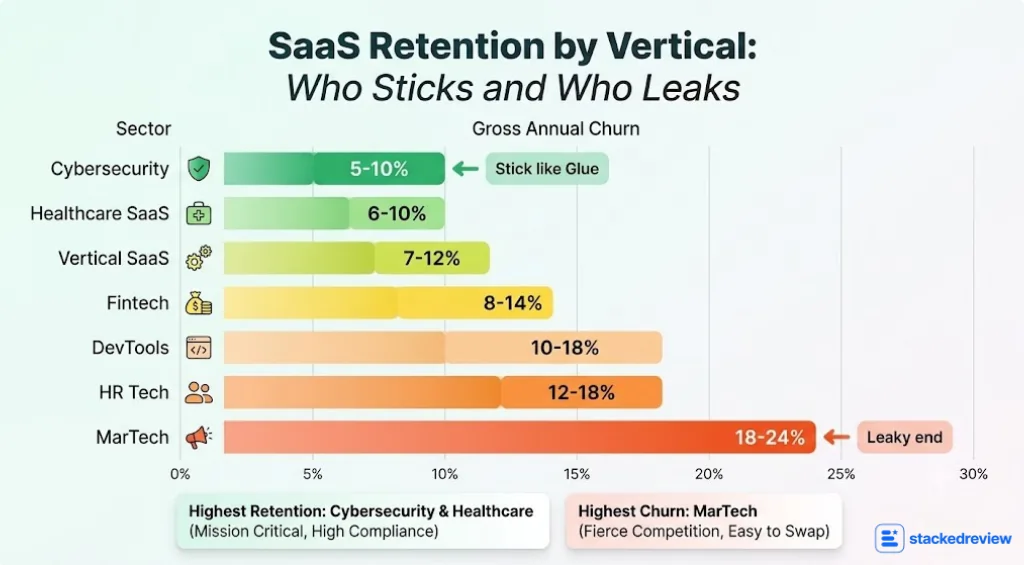
Not all software holds customers the same way. The spread across categories is huge, and comparing yourself to a global average produces nonsense. Cybersecurity and healthcare products stick like glue. Marketing tools slide out the door.
| Vertical | Gross annual churn | Why the number lands here |
|---|---|---|
| Cybersecurity | 5-10% | Compliance lock-in, mission critical |
| Healthcare SaaS | 6-10% | HIPAA rules, integration complexity |
| Vertical SaaS | 7-12% | Deep workflow fit, few alternatives |
| Fintech | 8-14% | Annual budget reviews, moderate lock-in |
| DevTools | 10-18% | Sticky infra, but strong net expansion |
| HR Tech | 12-18% | Annual contracts, feature overlap |
| MarTech | 18-24% | Fierce competition, easy to swap out |
Cybersecurity earns the lowest churn because nobody rips out their security stack on a whim. MarTech sits at the leaky end because budgets get re-checked every year and switching costs stay low.
The pattern holds on the consumer side too. Banking and financial services keep 89 to 95 per cent of customers a year. Media and professional services hold near 84 per cent. Retail sits closer to 63 per cent, and 30-day mobile app retention collapses to 4 to 5 per cent.
StackedReview take: Read your row, ignore the rest. A churn rate that would panic a DevTools team can be a perfectly normal year for a consumer fintech app. Benchmark against your neighbours, never against the market as a whole.
The First 90 Days Decide Almost Everything
If you fix one thing this year, fix onboarding. Around 70 per cent of churn happens in the first 90 days, and most of it is quiet. Users do not rage-quit. They simply never come back.
The single strongest predictor of month-12 retention is time to first value. Get a customer to their first win fast, and they stay. Let them drift, and you lose them.
| Time to first value | Month-12 retention | What it signals |
|---|---|---|
| Under 14 days | 80% or higher | Habit forms, product sticks |
| 15 to 30 days | Around 60% | Fragile, needs nudging |
| Past 30 days | 35 to 50% | Half the cohort already gone |
The activation problem hides in plain sight. Across B2B SaaS, the average user activation rate sits at just 37.5 per cent. Out of every ten sign-ups, fewer than four ever reach the moment the product was built for. The other six are pure acquisition cost with no return.
A few onboarding numbers we keep coming back to:
The cost angle makes it sharper still. Customer acquisition sits near $650 to $1,100 per B2B account in 2026. Lose that account in week one and the whole spend evaporates with nothing to show. For a growing product, a weak first week can quietly bleed seven figures of ARR a year.
AI is now rewriting this stage. Agentic onboarding, where the product configures itself and drafts the first result for the user, has halved time to first value in the tools that rebuilt around it. We rate this as the biggest near-term retention lever any team can pull.
StackedReview take: The retention battle moved from the renewal call to the first login. By the time a success manager steps in, a poorly onboarded user is already gone. Win week one and you win the year.
Why Retention Beats Acquisition Every Time
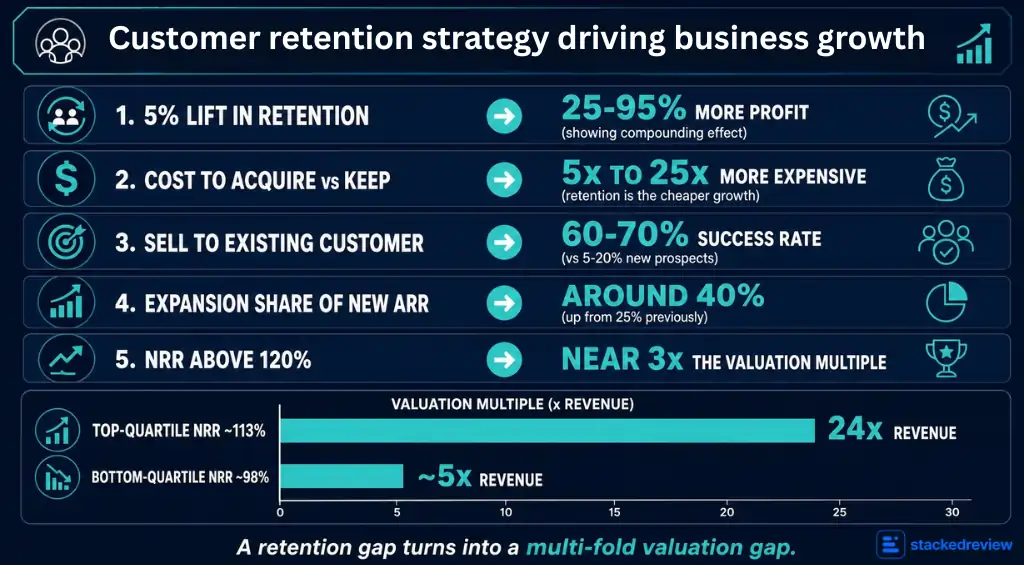
Growth-at-all-costs is over. Boards now treat retention as a core valuation input, not a vanity score. The maths explains why, and it is brutal for leaky products.
A company growing 40 per cent a year on new logos, with 95 per cent net retention, is building on sand. The sales engine must run faster and cost more every year just to replace the base it keeps losing.
Here is the money side of retention, based on figures we trust and check ourselves.
| Retention lever | The number | Why it pays |
|---|---|---|
| 5% lift in retention | 25-95% more profit | Compounding effect over time |
| Cost to acquire vs keep | 5 to 25x more expensive | Retention is the cheaper growth |
| Sell to existing customer | 60-70% success rate | New prospects convert at 5-20% |
| Expansion share of new ARR | Around 40% | Up from 25% in 2022 |
| NRR above 120% | Near 3x the valuation multiple | Investors pay for self-growth |
Expansion revenue is doing the heavy lifting now. It has climbed from about a quarter of new ARR to roughly 40 per cent, and it reaches the majority of growth at scale. Onboarding-to-adoption has become the engine of net retention, not a cost centre.
We see the valuation gap first-hand when we review SaaS tools. Top-quartile companies with net retention near 113 per cent trade at roughly 24 times revenue. Bottom-quartile peers at 98 per cent trade near 5 times. A 15-point retention gap turns into a fivefold valuation gap.
StackedReview take: Retention is not a support metric hiding in a dashboard. It is the cleanest predictor of what your company is worth. Protect gross retention first, then let expansion do the compounding.
What Makes Customers Stay, and What Makes Them Bolt
Numbers tell you how much churn happens. They do not tell you why. After years of reviewing tools, we see the same handful of causes over and over.
Poor customer service tops the list. Roughly three in four buyers cancel after a bad support run. Price sensitivity, by contrast, causes far less churn than most founders assume, closer to one cancellation in ten.
Indifference is the silent killer. A large share of customers walk because the company simply felt like it did not care. No check-ins, no help hitting value, no reason to stay.
Here is what keeps them, drawn from the accounts we track:
The pattern is consistent. Retention is not one grand gesture. It is a hundred small touches that add up to a customer who cannot picture switching.
StackedReview take: Customers rarely leave over one big failure. They drift out through neglect. Build the small habits that make your product feel indispensable, and the churn number takes care of itself.
How Contract Length and Pricing Bend the Numbers
Two structural choices quietly reshape every retention figure you report. Getting them right lifts your numbers without touching the product.
Contract length is the biggest lever. Annual billing cuts apparent monthly churn by 60 to 80 per cent against monthly plans in the same category. Cancellations can only land at renewal, so the monthly figure looks calmer. That is structure, not sentiment.
Pricing model shapes the ceiling on expansion. Usage-based and hybrid pricing let accounts grow spend as they grow value, which is why more than 80 per cent of SaaS firms now run some form of it. Flat monthly pricing caps your upside and leaves net retention stuck near your gross number.
The takeaway we hand every founder is simple. Move monthly customers to annual to steady the base, then add a metered way for heavy users to spend more. Those two moves alone shift the whole curve.
The AI-Native SaaS Retention Story of 2026
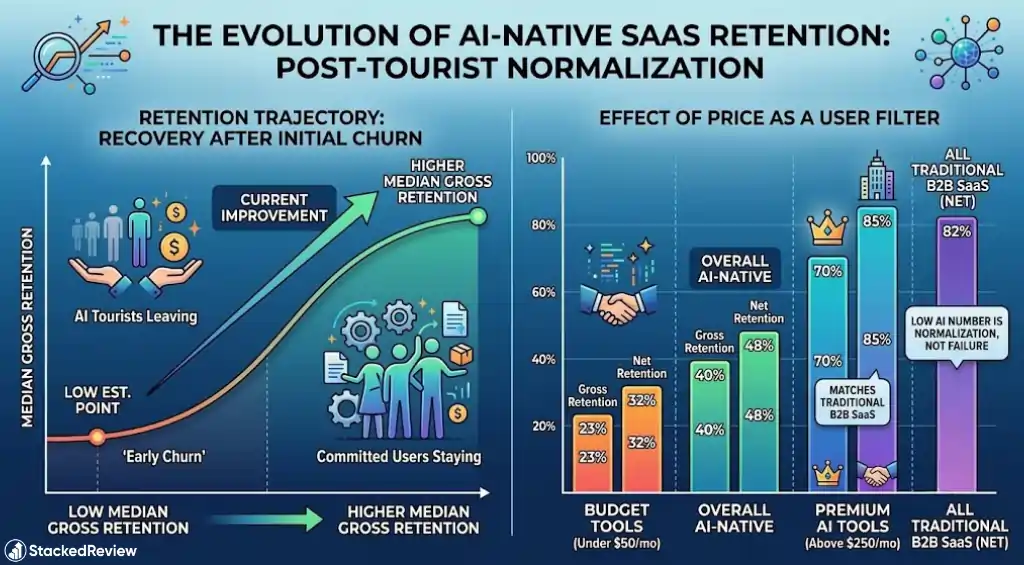
This is the freshest twist in the whole dataset, and it caught plenty of founders off guard. AI-native products posted brutal retention through 2025, and the recovery is only now taking shape.
Blame the “AI tourist” effect. People signed up to poke at the new shiny tool with no real workflow need. When novelty faded, they cancelled. Budget AI tools under $50 a month kept just 23 per cent of gross revenue after a year.
The good news? The floor is firming up. Median gross retention for AI-native SaaS retention climbed from 27 per cent in January 2025 to 40 per cent by September 2025 as the tourists left and committed users stayed.
Price acts as a filter, and the split by tier is stark:
That premium tier already matches traditional SaaS. The lesson writes itself: charge enough to attract users who actually need the product, not curious browsers poking at a shiny toy.
The wider B2B SaaS retention rate median still sits far above the AI average at 82 per cent net. So a low AI number does not mean the category is broken. It means the early-adopter wave is settling into a real, paying base. We rate this normalisation as the single most misread story in the 2026 data.
StackedReview take: If you run an AI product, your early churn is not a death sentence, it is a filter. Watch the retention of your paying, high-usage cohort. That number tells you if you have a real business or a demo.
Product-Led Growth Changes Where Churn Hides
Product-led growth shifts the churn window earlier. In 2026, 60 to 70 per cent of PLG churn happens inside the first 30 days. The renewal date is almost irrelevant if the user never activated in the first place.
That is why activation rate has overtaken logo retention as the headline KPI for PLG teams. If a user hits the aha moment fast, retention takes care of itself. If not, no amount of renewal-stage effort saves them.
A quick note on measurement, because it trips people up. Annual contracts cut apparent monthly churn by 60 to 80 per cent versus monthly billing in the same category. That is a structural effect, not a real improvement in how happy customers are. Always say if you mean monthly or annual, logo or revenue.
Our SaaS Retention Projections for 2027
Time for our own calls. These are StackedReview estimates, built from the accounts we track and the direction the 2026 numbers point. Treat them as informed bets, not gospel.
Our reasoning is simple. Acquisition keeps getting pricier, so the cheapest ARR left on the table sits inside your existing base. The teams that win 2027 will be the ones who shorten the gap between a churn signal and a fix.
Turning These Retention Benchmarks Into Moves
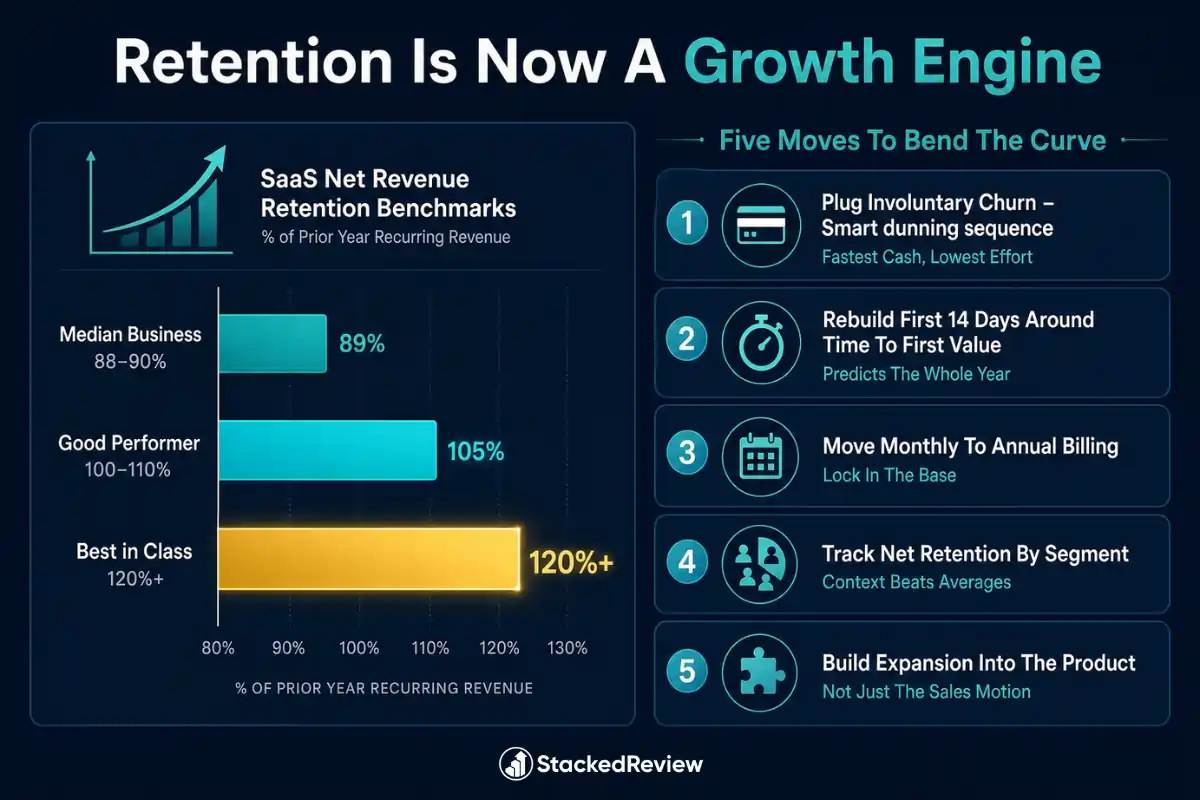
The 2026 SaaS Retention Rate Statistics point one direction. Retention is now a growth engine, not a defensive metric. The median business keeps 88 to 90 per cent of revenue, the best push net retention past 120 per cent, and the gap between them decides valuation.
Here is where we would start if the numbers were ours to fix.
Get those five right and your retention curve bends the right way. The data is now in your hands, so the only question left is how fast you act on it.
FAQs About SaaS Retention Rate in 2026
What is a good SaaS retention rate in 2026?
A good annual revenue retention rate sits at 90 per cent or higher, paired with net revenue retention above 110 per cent. Elite companies clear 120 per cent net retention. Median businesses land near 88 to 90 per cent gross and 100 to 104 per cent net.
What is the average SaaS churn rate in 2026?
The median B2B SaaS company loses around 10 per cent of revenue and logos a year. Monthly logo churn runs below 0.5 per cent for enterprise, 0.5 to 1.5 per cent for mid-market, and 2 to 4 per cent for SMB products.
What is the difference between gross and net revenue retention?
Gross revenue retention measures money kept before any upsell, and cannot beat 100 per cent. Net revenue retention adds expansion back in, so it can climb past 100 per cent when upsells outpace losses.
Which SaaS verticals have the best retention?
Cybersecurity and healthcare hold customers best, with gross annual churn of 5 to 10 per cent. MarTech leaks the most at 18 to 24 per cent, driven by low switching costs and fierce competition.
When does most SaaS churn happen?
Around 70 per cent of churn hits in the first 90 days, and 60 to 70 per cent of product-led churn lands inside 30 days. Onboarding and time to first value decide most of it.
Why does net revenue retention matter so much for valuation?
Companies with net retention above 120 per cent grow from their existing base without new sales. They trade at close to three times the valuation multiple of firms below 100 per cent. Buyers pay a premium for revenue that compounds on its own.

Sources and References
We cross-checked every one of these retention figures against trusted industry data before publishing. The primary sources below are worth a read if you want the raw numbers.
- Statista, SaaS and customer retention data
- SaaS Capital, retention and valuation benchmarks
- Bessemer Venture Partners, Cloud Index
- Recurly, subscription and churn research
- ChartMogul, SaaS retention reports
- OpenView Partners, product benchmarks
- KeyBanc Capital Markets, private SaaS survey
- Gartner, SaaS market and AI forecasts
- Bain and Company, customer loyalty economics
- Harvard Business Review, retention and profit research
Affiliate Disclosure: This post may contain some affiliate links, which means we may receive a commission if you purchase something that we recommend at no additional cost for you (none whatsoever!)
Similar Posts




Verification process
Editorial standards
We’re a team of real users — not bots, not press-release copiers. Here’s exactly how we earn your trust on every single post.
We Actually Buy the Products
Every deal on this site is tested with a real purchase using our own accounts. We don’t rely on screenshots sent by vendors or press kits. If we say the discount works, we’ve clicked through checkout ourselves.
No Pay-to-Rank Policy
We never accept payment to feature or rank a deal higher. Affiliate commissions don’t influence our editorial scores — a bad deal stays ranked low regardless of commission size.
Monthly Re-Verification
Pricing changes fast. Our team re-tests every published deal at least once a month and immediately updates or removes any that have expired, changed, or been capped.
Expert Editorial Team
Our writers and editors have collectively spent 40,000+ hours hands-on with digital tools. We know what a fair price looks like — and we call out bad deals even when they’d earn us commissions.
Transparent Scoring Criteria
Every score is calculated from a public rubric: discount value, feature-to-price ratio, redemption ease, plan flexibility, and competitor comparison. No hidden weighting, ever.
Reader Feedback Loop
Thousands of readers report broken deals each month. Our team investigates every report within 24 hours and updates the page the same day a deal stops working.
Jaclyn Donaldson
Jaclyn is a content strategist at StackedReview with a passion for empowering small businesses. She specializes in dissecting social media advertising costs and hunting down the best-value deals. Her goal is to help brands stretch their budget further without compromising on results.