
SaaS Churn Rate Statistics 2026 Benchmarks By Customer Segment

By :
Jaclyn Donaldson
July 27, 2026
The average B2B SaaS churn rate in 2026 sits around 3.5%, and that tiny number quietly decides if your business compounds or leaks cash.
Here at StackedReview, we live inside SaaS tools all day, so we pulled the freshest 2026 figures and stress-tested every one.
The headline? Enterprise keeps churn under 1%, SMB bleeds 4 to 7% a month, and AI tools have become the wild card nobody planned for.
We have packed these SaaS churn rate statistics into plain tables and honest calls. Grab a coffee. Your retention maths is about to get much clearer.
SaaS Churn Rate Statistics 2026: The Big Numbers At A Glance
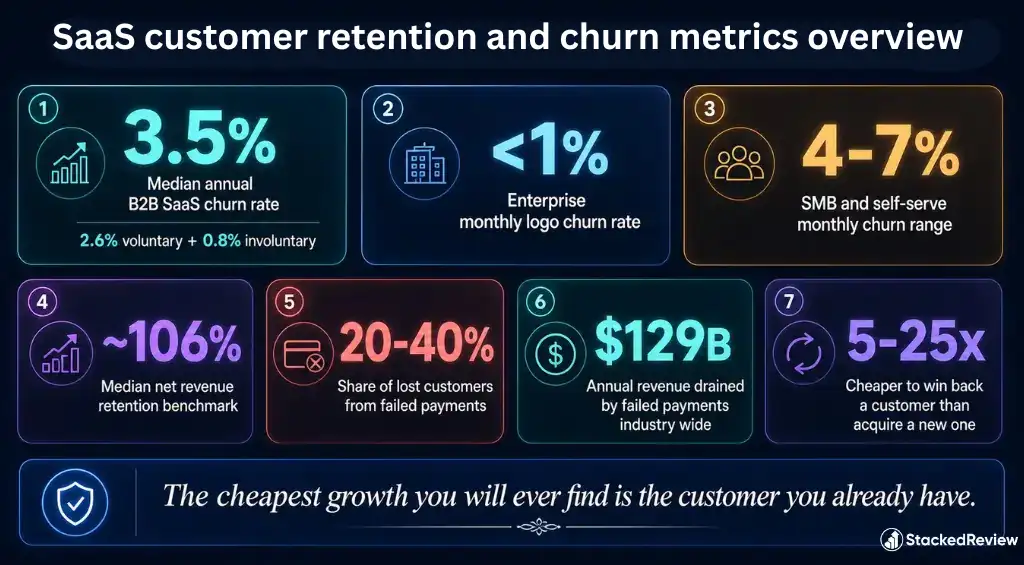
We have reviewed hundreds of SaaS products over the years. One truth keeps showing up. Growth gets the applause, but retention pays the bills.
So we gathered the current 2026 data and cut the noise. Here are the figures every founder and marketer should have pinned to the wall.
That last point is the one we shout about most. Acquisition is loud and expensive. Retention is quiet and cheap.
Our honest read: most SaaS teams still spend like acquisition is the whole game. In 2026, the smart money has flipped. The cheapest growth you will ever find is the customer you already have.
Churn Rate Vs Retention Rate: Clearing Up The Basics First
Before the big numbers, a quick reset. Churn and retention are two sides of one coin.
Churn is the share of customers or revenue you lose in a set period. Retention is the share you keep. If your monthly churn is 3%, your monthly retention is 97%. Simple as that.
Two flavours matter most. Customer churn counts logos lost. Revenue churn counts pounds lost. The two can move in opposite directions. You can shed small accounts while big ones expand.
Revenue churn is the one investors care about. Losing ten tiny users hurts far less than losing one whale.
Quick tip from our team: always report both. Logo churn tells you about product fit. Revenue churn tells you about the health of your money.
How To Calculate Your SaaS Churn Rate In One Minute
Churn maths is simpler than it looks. You do not need a data team to run it.
For customer churn, take the customers lost in a period. Divide by the customers you started with. Say you began the month with 500 customers and lost 15. That gives a 3% monthly customer churn rate.
Revenue churn works the same way, but with money. Take the recurring revenue lost, then divide by the revenue you started with.
Fold expansion into the mix and you get net revenue churn. Subtract upgrades and cross-sells from your losses first. One habit saves a lot of pain. Pick a window, monthly or yearly, and use it every single time.
A rule we live by: measure churn the same way each period. Consistency beats precision when you are hunting a trend.
What Counts As A Good SaaS Churn Rate By Customer Segment
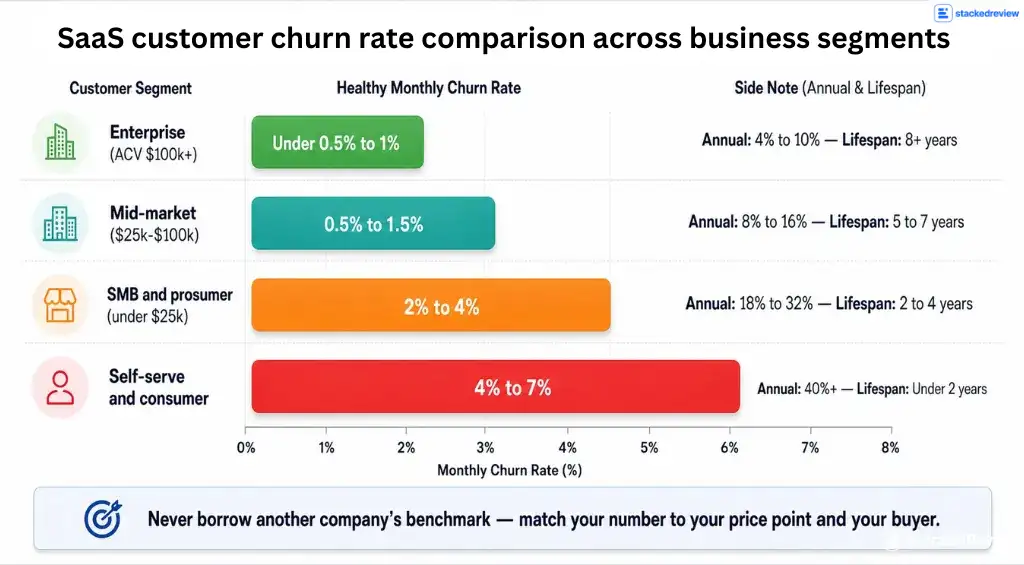
People love asking us, “is my churn good or bad?” Our answer is always the same. It depends who you sell to. A 4% monthly rate is fine at $500k ARR selling to small firms. The same 4% at $20m ARR selling to enterprise is a five-alarm fire.
So we mapped the healthy ranges by segment for 2026. This is the table we wish every new founder saw on day one.
| Customer segment | Healthy monthly churn | Rough annual logo churn | Typical customer lifespan |
|---|---|---|---|
| Enterprise (ACV $100k+) | Under 0.5% to 1% | 4% to 10% | 8 years or more |
| Mid-market ($25k to $100k) | 0.5% to 1.5% | 8% to 16% | 5 to 7 years |
| SMB and prosumer (under $25k) | 2% to 4% | 18% to 32% | 2 to 4 years |
| Self-serve and consumer | 4% to 7% | 40% or higher | Under 2 years |
Notice the huge gap. Enterprise and SMB churn are not even in the same universe.
The reason is simple. A $200 tool gets cancelled on a Tuesday afternoon. A $50k platform needs a committee, a migration plan and six months of internal debate.
Straight from our desk: never borrow another company’s benchmark. Match your number to your price point and your buyer. A “bad” SMB rate might be a stellar enterprise rate, and vice versa.
Monthly Churn Vs Annual Churn: The Number That Fools Everyone
Here is a trap that catches almost everyone. You will see 3.5% quoted as both monthly and annual churn. Both can be correct.
The answer sits in the dataset and the window measured. One report tracks billing platforms monthly. Another tracks startups yearly.
Annual churn is not simply monthly times twelve. Compounding changes the maths. A 3% monthly rate works out near 31% a year, not 36%. The formula is one minus (one minus the monthly rate) to the power of twelve.
So always check the window before you panic or celebrate. A churn number with no timeframe means nothing.
The mistake we see most: founders compare their annual rate against someone else’s monthly rate. Then they either celebrate too early or spiral for no reason. Match the window first.
Churn Rate By Company Size And ARR Stage
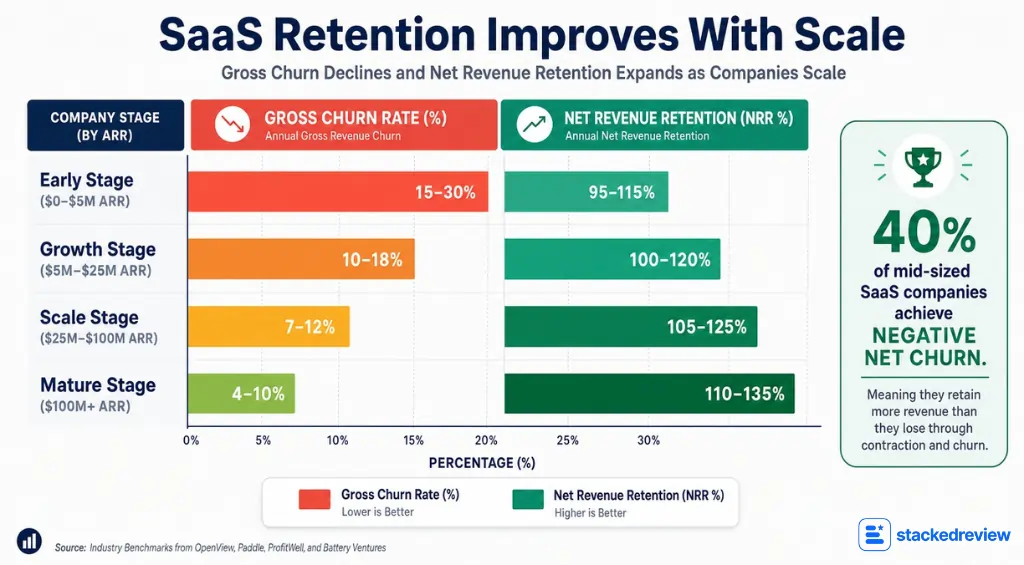
Churn does not sit still as you grow. Early-stage tools bleed the fastest, because tiny customers fail, forget and cancel with zero friction. Then the picture improves. Bigger contracts and deeper product usage lock people in.
We pulled the 2026 stage-by-stage view below. The retention story gets healthier as the annual recurring revenue base climbs.
| ARR stage | Annual gross churn | Typical NRR range | What we usually see |
|---|---|---|---|
| Early ($0 to $5m) | 15% to 30% | 95% to 115% | Product-market fit still shaky, high logo loss |
| Growth ($5m to $25m) | 10% to 18% | 105% to 125% | Onboarding fixes start compounding |
| Scale ($25m to $100m) | 7% to 12% | 110% to 130% | Expansion revenue does the heavy lifting |
| Mature ($100m+) | 4% to 10% | 110% to 135% | Sticky contracts, land-and-expand motion |
One stat stopped us in our tracks. By 2026, around 40% of SaaS companies with $15m to $30m ARR have hit negative net churn. That means expansion from existing accounts now beats the revenue they lose. The growth flywheel spins on its own.
What we would do: if you are under $5m ARR, obsess over onboarding before anything else. Most early churn is not a product problem. It is a “customer never reached value” problem.
Churn By Go-To-Market Motion: PLG Vs Sales-Led Teams
How you sell shapes how well you keep. Go-to-market motion changes the churn picture more than most people expect.
Product-led growth with expansion built in retains best. Those teams post NRR of 115 to 145%.
Enterprise sales-led motions land 110 to 135%. The contracts are large and sticky.
Low-touch SMB self-serve sits lowest, around 90 to 110%. Easy in, easy out. The pattern is clear. More human touch and higher contract value mean slower churn.
Self-serve wins on volume and speed. It loses on loyalty, so expansion revenue has to carry the weight.
What we would balance: self-serve for reach, plus a proper success motion for the accounts worth keeping. Do not give every customer the same low-touch treatment.
SaaS Churn Rates By Industry Vertical In 2026
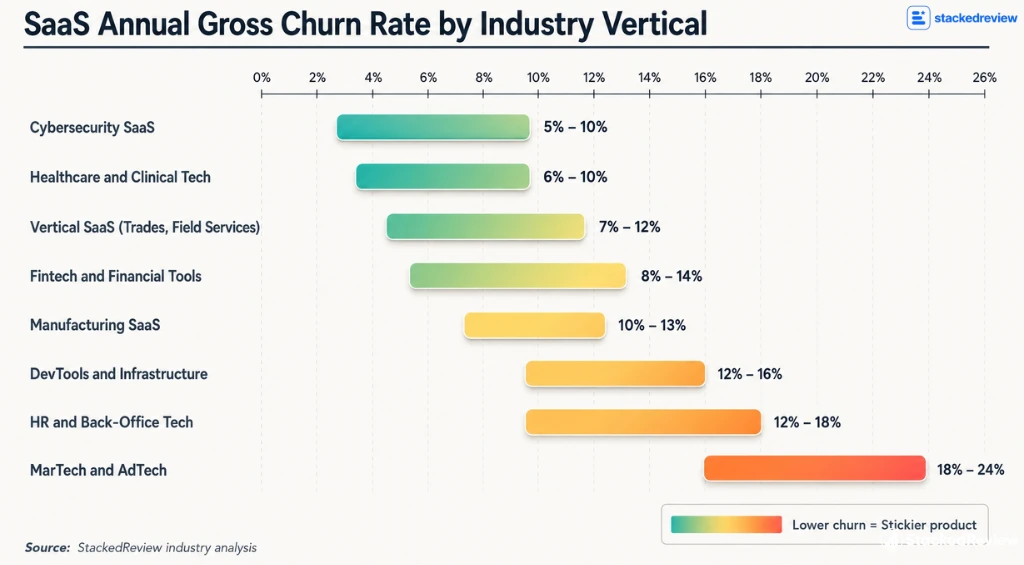
Here is where averages fall apart completely. Vertical matters more than most teams admit.
Regulated, sticky categories keep customers for years. Fast-moving, easy-to-swap tools lose them every renewal.
We built the vertical table below from the latest 2026 reporting. These are annual gross churn ranges, so you can size up your own patch quickly.
| Industry vertical | Annual gross churn | Why it lands here |
|---|---|---|
| Cybersecurity SaaS | 5% to 10% | Compliance lock-in, mission-critical, hard to rip out |
| Healthcare and clinical tech | 6% to 10% | Data migration pain, long switching cycles |
| Vertical SaaS (trades, field services) | 7% to 12% | Deeply embedded in daily operations |
| Fintech and financial tools | 8% to 14% | Regulatory barriers, but tight buyer budgets |
| Manufacturing SaaS | 10% to 13% | Slow adoption, integration heavy |
| DevTools and infrastructure | 12% to 16% | Usage swings with engineering headcount |
| HR and back-office tech | 12% to 18% | Sticky after payroll setup, softer before it |
| MarTech and AdTech | 18% to 24% | Constant ROI pressure, easy to replace, the leakiest of all |
MarTech is the standout pain point. Buyers re-evaluate marketing tools every year and switching costs are low.
The other shock of 2025 was education. Customer churn in EdTech doubled from 11% to 22%, hammered by school budget cuts and seasonal spending.
Healthcare revenue churn also jumped 67% year on year. Budget squeezes and consolidation did the damage.
The StackedReview angle: if you sell MarTech, retention is your growth strategy, full stop. You cannot out-acquire an 20%-plus leak. Prove ROI inside 30 days or watch renewals walk.
Voluntary Vs Involuntary Churn: The Split Nobody Talks About Enough
Not all churn is a rejection. A big chunk is pure accident. Involuntary churn happens when a card expires or a payment fails. The customer wanted to stay. The billing system let them slip.
This is the cheapest churn to fix, and most teams ignore it. We find it maddening.
| Churn type | Share of total churn | Annual B2B rate | Fixability |
|---|---|---|---|
| Voluntary (active cancellations) | 60% to 80% | About 2.6% | Product and value work required |
| Involuntary (failed payments) | 20% to 40% | About 0.8% | High, 50% to 85% recoverable |
Here is the kicker. Up to 85% of failed-payment churn can be recovered with fast follow-up.
Smart dunning and retry logic claw back 50 to 80% of those payments with zero product changes. That is free money sitting on the table.
Voluntary churn is the harder signal. It tells you the product is not delivering enough value to justify the spend.
Our take on the fix: treat involuntary churn recovery as a finance job, not a support afterthought. Better card-retry rules and dunning emails are the fastest retention win in all of SaaS.
B2C Vs B2B Churn: Why Consumer Tools Leak Faster
Business and consumer churn live in different worlds. Business tools stick. Consumer apps slip away.
The average B2B voluntary churn rate is about 3.5%. B2C sits higher, near 4%.
The gap widens once involuntary churn joins in. Consumer tools in media, retail and education often lose 6.5 to 8% of users a month.
Why the difference? Switching costs, plain and simple. A tool tied to payroll or daily workflows is painful to rip out.
A consumer app is one tap from cancellation. No committee. No migration. Just goodbye.
Subscription ecommerce shows the extreme. It averages around 3.4% monthly churn, and DTC boxes can hit 6.5 to 10%.
Our read on the split: if you sell to consumers, assume higher churn is baked in. Win on habit and delight, because you cannot win on lock-in.
Net Revenue Retention And Gross Revenue Retention Benchmarks
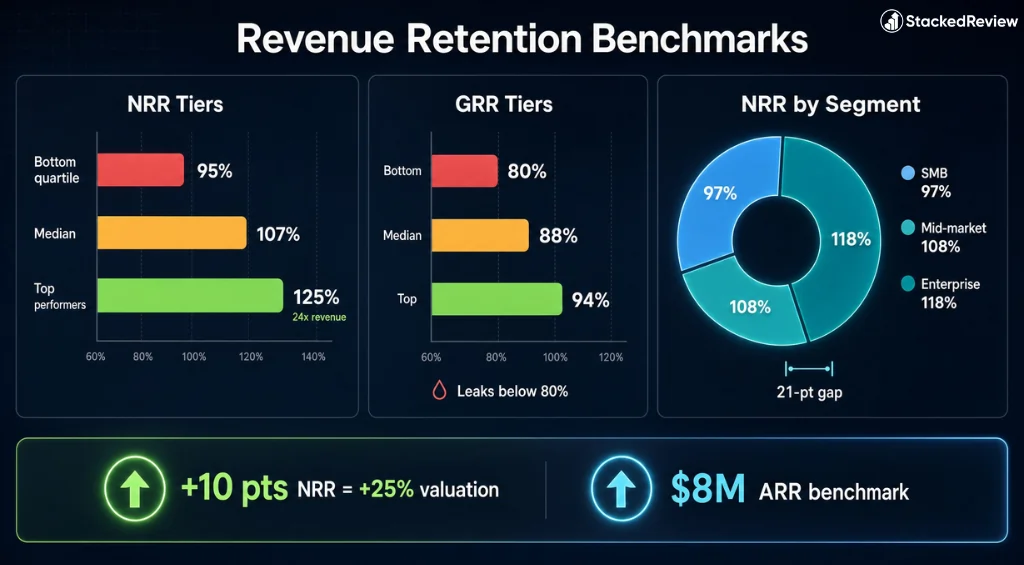
Two metrics rule the boardroom in 2026: NRR and GRR. Investors now watch them harder than raw growth.
Net revenue retention counts expansion, upgrades and cross-sells against your losses. Above 100% means you grow even if you sign zero new logos.
Gross revenue retention strips out expansion. It shows the raw leak, and it cannot beat 100%.
| Metric | Bottom quartile | Median | Top performers | Valuation signal |
|---|---|---|---|---|
| Net revenue retention (NRR) | Under 95% | 106% to 108% | 120% to 130%+ | Top NRR can trade near 24x revenue |
| Gross revenue retention (GRR) | Under 80% | 88% | 94%+ | Under 80% flags a leaky product |
| NRR by segment | SMB 97% | Mid-market 108% | Enterprise 118% | 21-point gap top to bottom |
The median NRR has slipped over time. It fell from roughly 105% in 2021 to about 101% in 2024 across private SaaS.
Expansion got harder as buyers tightened budgets. So gross retention is back as the number that matters most.
The best public names show what great looks like. Snowflake posted 125% NRR and Datadog around 120%, both on usage-based pricing.
Why we rate this: a 10-point NRR jump can lift your valuation 20 to 30%. For an $8m ARR business, that is the gap between a nice exit and a life-changing one.
AI-Native SaaS Churn: The Wildest Retention Story Of 2026
This is the plot twist of the year. AI tools churn far faster than classic SaaS, and the data is brutal.
We call it the “AI tourist” effect. People sign up out of curiosity, poke around, then vanish. Cheap AI tools get hit hardest. Premium AI tools that solve real workflows retain like proper software.
| AI SaaS tier | Gross revenue retention | Net revenue retention | What it tells us |
|---|---|---|---|
| Budget AI (under $50/mo) | About 23% | About 32% | Curiosity sign-ups, brutal early churn |
| Mid-tier AI ($50 to $250/mo) | 40% to 55% | 48% to 65% | Stickiness depends on daily habit |
| Premium AI ($250/mo+) | About 70% | About 85% | Matches solid B2B SaaS retention |
There is a silver lining, though. Median AI-native SaaS retention is climbing as the tourists filter out.
Gross retention for AI-native tools rose from 27% at the start of 2025 to 40% by later in the year. The base is stabilising.
Our 2026 call: we expect median AI-native GRR to reach roughly 48 to 52% by year end. Pricing and real workflow value are the only two levers that fix AI churn.
Billing Cadence And Pricing Models: The Hidden Churn Multiplier
Your pricing page is a retention tool in disguise. Most teams never see it that way.
Billing cadence is the single biggest lever we know. Annual plans crush monthly plans on retention. Annual subscribers churn at roughly one-third the rate of monthly ones. The commitment does the work.
Switching your default from monthly to annual, with a 15 to 20% nudge, can cut churn 40 to 60%.
Pricing model matters just as much. Usage-based and per-seat models grow with the customer. When an account expands, so does your revenue, with no fresh sale needed. That is how negative net churn happens.
Flat monthly pricing is the leakiest of the lot. It hands customers a monthly off-ramp and no reason to grow.
The lever we push first: move to annual-default billing. It is the cheapest, fastest churn cut in the whole toolkit, and it needs zero engineering.
Why SaaS Customers Actually Cancel
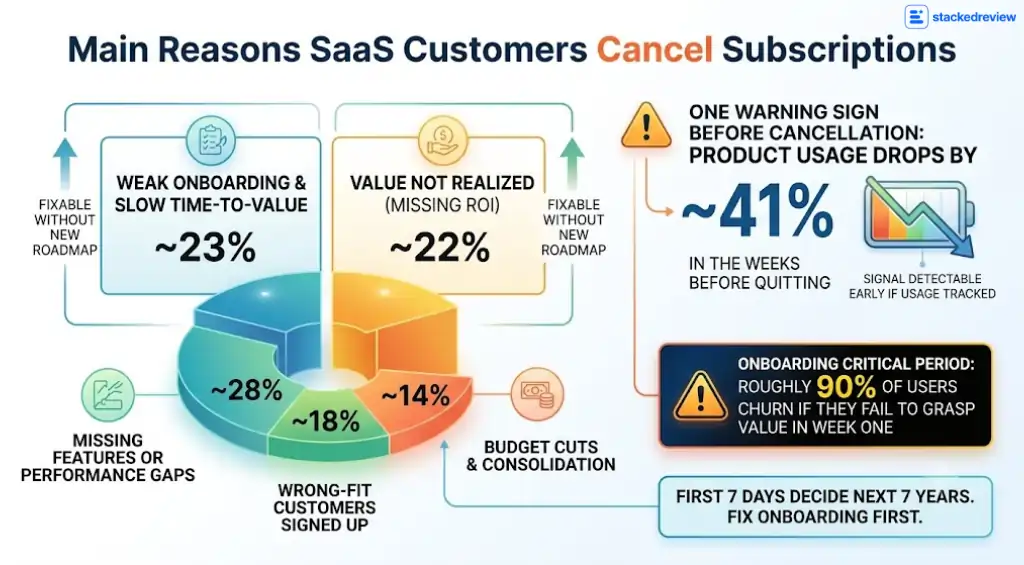
Numbers are useless without the “why”. So we grouped the real churn drivers behind the 2026 data.
Two causes sit above all others: weak onboarding and unclear value. Both are fixable without touching your roadmap.
One warning sign shows up before every cancellation. Product usage drops by around 41% in the weeks before someone quits.
That decline is detectable early, if you track usage properly. The signal is there. Most teams simply are not watching.
Onboarding is the scariest stat of all. Roughly 90% of users churn if they fail to grasp a product’s value in week one.
What we tell every founder: your first seven days decide the next seven years. Fix onboarding first. It carries more retention weight than any feature you could ship.
The Real Cost Of SaaS Churn In 2026
Let us talk money, because churn is not a vanity metric. It is a leak in your bank account.
Customer acquisition costs have climbed hard. Median B2B SaaS CAC now sits near $1,200 per customer, with ad prices up sharply since 2020.
So every lost customer is a paid-for asset walking out the door. The maths gets ugly fast.
That final gap is the opportunity. Most companies pour cash into the top of the funnel while the bottom leaks freely.
We think that imbalance is the biggest self-inflicted wound in SaaS today. Retention tooling returns about 3.2x on average. Few investments beat it.
Our blunt view: if your retention budget is a rounding error next to your ad spend, your growth model is broken. Plug the leak before you pour in more water.
Retention Moves That Actually Work This Year
We have watched what separates sticky products from leaky ones. The winners are not doing anything magical. They are doing the basics relentlessly.
Here is the short playbook we would run in 2026, ranked by payoff.
None of these need a heroic product rebuild. They need discipline and the right tools.
The move we back hardest: annual billing. Switching monthly-default to annual-default can cut churn 40 to 60% on its own. It is the highest-return lever we know.
The 2025 To 2026 Churn Shift: What Really Changed
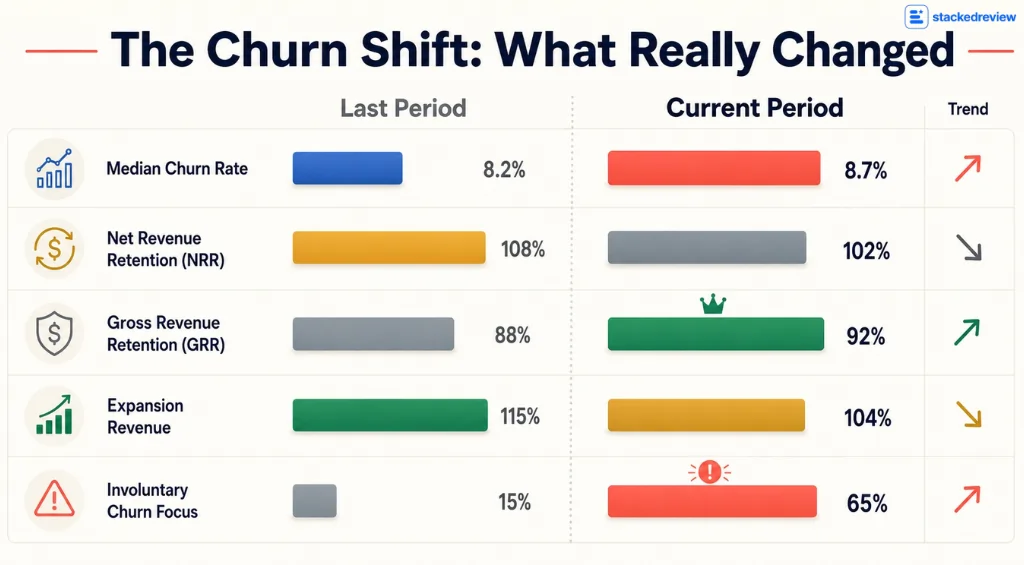
So what actually moved heading into 2026? A few clear shifts stand out from the data.
Median churn ticked up about half a point from 2024. Buyers got stricter and seat growth slowed.
Net revenue retention stopped being the darling metric. Gross retention took its crown. Expansion got harder to earn, so the raw leak became the number investors trust most.
AI tools rewrote the rulebook. The market split into curious tourists and true workflow users. And involuntary churn finally got the attention it deserved. Teams woke up to how much free revenue was slipping away.
Our summary of the year: 2026 is the year retention grew up. Growth-at-all-costs is out. Keeping what you earned is in.
Our 2026 Churn Projections And Estimates
Now for the part we get paid to have an opinion on. Based on everything we track, here is where we think churn heads next.
These are our informed calls, not gospel. But we have sat with this data long enough to back them.
Our broader belief is simple. The 2026 winners will treat retention as a product discipline, owned at the top, not a support ticket queue.
Growth is getting more expensive everywhere. The customer lifetime value you protect is worth more than the logo you chase.
Where we plant our flag: gross retention is the metric of the year. Expansion can mask a leaky bucket for a while. It cannot save you forever.
SaaS Churn Rate FAQs Founders Ask Us Most
What is a good SaaS churn rate in 2026?
A healthy monthly churn rate is under 1% for enterprise products and 2 to 4% for SMB and self-serve tools. The B2B SaaS average sits near 3.5%, so anything well above that needs investigating.
What is the average B2B SaaS churn rate?
The median B2B SaaS annual churn rate is about 3.5%. That splits into roughly 2.6% voluntary cancellations and 0.8% involuntary failed payments.
Which SaaS industry has the highest churn?
MarTech and AdTech lead the pack, with annual gross churn of 18 to 24%. EdTech also spiked hard, with customer churn doubling to 22% in 2025.
What is negative churn and who has it?
Negative net churn means expansion revenue beats lost revenue, so you grow with zero new sign-ups. By 2026, around 40% of $15m to $30m ARR companies have reached it.
How much does churn actually cost?
Winning a new customer costs 5 to 25 times more than keeping one. A 5% retention lift can raise profits 25 to 95%, and failed payments drain about $129 billion a year across subscriptions.
Why do AI SaaS tools churn so fast?
The “AI tourist” effect. Curious users sign up, test the novelty, then leave. Budget AI tools under $50 a month can see gross retention as low as 23%.
A Final Word From The StackedReview Desk
If you take one thing from these SaaS churn rate statistics, make it this. Retention is the growth engine hiding in plain sight.
The average churn number is a starting point, never a verdict. Match your benchmark to your segment, your price and your vertical.
Then go plug the leaks. Fix onboarding, recover failed payments, push annual plans and watch the compounding do its work.
We will keep updating these figures as fresh 2026 data lands. That is the promise. Honest numbers, plain English, no hype.

Sources And References
- Recurly Churn Report and benchmark data
- ChartMogul SaaS Retention Report
- Statista subscription and SaaS statistics
- Bain and Company customer retention research
- Lighter Capital B2B SaaS Startup Benchmarks
- Benchmarkit and Maxio SaaS Benchmarks Report
- SaaS Capital retention research
- Paddle and ProfitWell subscription data
- OpenView and High Alpha SaaS benchmarks
- Gartner and Forrester SaaS research
Affiliate Disclosure: This post may contain some affiliate links, which means we may receive a commission if you purchase something that we recommend at no additional cost for you (none whatsoever!)
Similar Posts




Verification process
Editorial standards
We’re a team of real users — not bots, not press-release copiers. Here’s exactly how we earn your trust on every single post.
We Actually Buy the Products
Every deal on this site is tested with a real purchase using our own accounts. We don’t rely on screenshots sent by vendors or press kits. If we say the discount works, we’ve clicked through checkout ourselves.
No Pay-to-Rank Policy
We never accept payment to feature or rank a deal higher. Affiliate commissions don’t influence our editorial scores — a bad deal stays ranked low regardless of commission size.
Monthly Re-Verification
Pricing changes fast. Our team re-tests every published deal at least once a month and immediately updates or removes any that have expired, changed, or been capped.
Expert Editorial Team
Our writers and editors have collectively spent 40,000+ hours hands-on with digital tools. We know what a fair price looks like — and we call out bad deals even when they’d earn us commissions.
Transparent Scoring Criteria
Every score is calculated from a public rubric: discount value, feature-to-price ratio, redemption ease, plan flexibility, and competitor comparison. No hidden weighting, ever.
Reader Feedback Loop
Thousands of readers report broken deals each month. Our team investigates every report within 24 hours and updates the page the same day a deal stops working.
Jaclyn Donaldson
Jaclyn is a content strategist at StackedReview with a passion for empowering small businesses. She specializes in dissecting social media advertising costs and hunting down the best-value deals. Her goal is to help brands stretch their budget further without compromising on results.