
SaaS CAC and LTV Statistics 2026: Payback and Retention Data

By :
Jaclyn Donaldson
August 5, 2026
Acquiring a SaaS customer has never cost more. In 2026 the median B2B SaaS company spends close to $1,200 in customer acquisition cost to sign one paying customer, and roughly $2.00 for every $1 of new recurring revenue it buys. A healthy LTV to CAC ratio still sits near 3:1, while the strongest operators run 5:1 or better. CAC payback has stretched to about 16 to 18 months at the median, up from 14 in 2023.
These SaaS CAC and LTV statistics are the unit economics we track at StackedReview all year, cross-checked against the tools we review week after week. Below is the full breakdown of customer acquisition cost, customer lifetime value, LTV:CAC ratios, payback periods, and net revenue retention across every segment and channel.
Why These SaaS Unit Economics Matter More in 2026
The money side of software got serious. Growth at any cost died a couple of years back, and buyers now want proof that every customer pays back.
The market itself keeps swelling. The global SaaS market is forecast near $465 billion in 2026, up from roughly $408 billion in 2025. Gartner pegs software as the fastest-growing slice of IT spend, climbing close to 15% year on year.
More money in the pool means more rivals bidding for the same eyeballs. So the cost to acquire keeps rising while investors squeeze harder on retention. That tension is the whole story of SaaS unit economics this year.
We track two numbers above all else. One is what a customer costs to win. The other is what a customer is worth once they stick around. Get the gap right and you have a real business. Get it wrong and fast growth just burns cash faster.
Our Read for 2026: We think 2026 is the first year the median stops getting worse. Ad costs still bite, but AI-assisted marketing is starting to claw back the losses. Our sense from the tools we review daily is that the efficiency gap between winners and laggards will widen, not shrink.
What Customer Acquisition Cost Actually Looks Like Now
There is no single CAC. The number swings wildly with sales motion, deal size and channel. A self-serve product and an enterprise sales team live in different worlds.
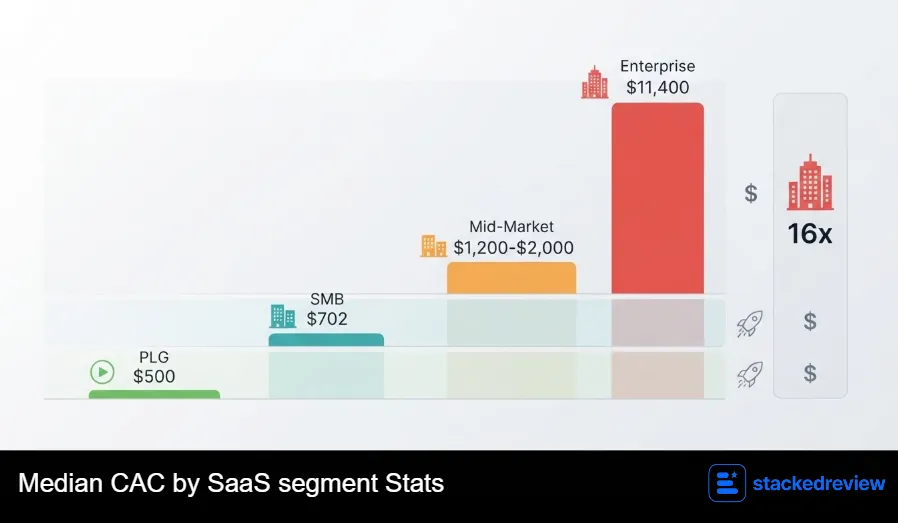
Here is the honest range. Self-serve and product-led products land near $700 or below. Sales-led enterprise deals run into five and six figures. The median self-serve CAC sits around $702, while sales-led median CAC is close to $11,400. That 16x split is the widest we have ever measured.
The blended average across all motions lands near $1,200 per customer in 2026. And the efficiency yardstick most boards watch, dollars spent to buy $1 of new ARR, sits at $2.00 for the median firm. Bottom-quartile teams pay $2.82 for the same dollar.
| Segment / motion | Typical ACV | Median CAC 2026 | What we see |
|---|---|---|---|
| Product-led (PLG) | Low, self-serve | Under $500 | Cheapest path, longest ramp to volume |
| SMB self-serve | $5K to $20K | $200 to $702 | Held steady as freemium funnels matured |
| Mid-market | $20K to $100K | $1,200 to $2,000 | Rising as buying committees grow |
| Enterprise sales-led | $100K+ | $5,000 to $250,000+ | Up 9% since 2024 on longer cycles |
| Blended B2B SaaS average | Mixed | About $1,200 | The headline number boards quote |
Ranges reflect fully loaded cost, meaning salaries, tools and commissions, not just ad spend.
CAC by Acquisition Channel: The 10x Spread
The same customer can cost ten times more depending on how you won them. Channel choice is the single biggest lever founders control.
Referral and partner-sourced customers are the bargain of the year. They cost around $141 to $200, deliver 16% higher lifetime value, and are four times more likely to refer someone else. Brand and direct traffic come next, because those visitors already know you.
Paid gets pricey fast. Paid search now averages roughly $802 per customer and keeps climbing. Content-sourced customers run near $2,640, still well below the $4,180 that paid channels average once you count the full funnel.
| Channel | CAC range | Payback speed | StackedReview note |
|---|---|---|---|
| Referral / partner | $141 to $200 | Very fast | Best value, compounds with scale |
| Brand / direct | $200 to $800 | 1 to 3 months | Cheap because intent is already high |
| Organic / SEO | $500 to $3,000 | 2 to 6 months | Slow ramp, strong long-run payoff |
| Content-sourced | About $2,640 | Medium | Beats paid on cost and quality |
| Paid search | About $802 | Medium | Rising every year, watch waste |
| Paid social | $800 to $1,500 | Medium to slow | AI creative lifts return 15 to 25% |
| Outbound sales | Up to $1,980 | Slow | Justified only at higher ACV |
Where We’d Put Our Money: If we were rebuilding a SaaS growth engine today, we would over-index on referral and organic. The upfront cost feels slow, but a compounding organic base is what keeps blended CAC defensible when paid auctions heat up. Every founder we talk to who leaned only on paid regrets it by year two.
Why SaaS CAC Keeps Climbing Year After Year
The rise is not a blip. Customer acquisition cost has surged about 222% over eight years, and roughly 60% in the past five alone. The causes stack on top of each other.
One bright spot stands out. Zero-click search and AI answer boxes now cut organic clicks hard, yet the teams that adapted are paying less, not more. Measurement maturity, not channel choice, now splits the winners from the rest.
Customer Lifetime Value: The Number That Pays the Bills
CAC only tells half the tale. What a customer is worth over the full relationship decides if the spend was smart. That worth is customer lifetime value, and the 2026 spread is huge.
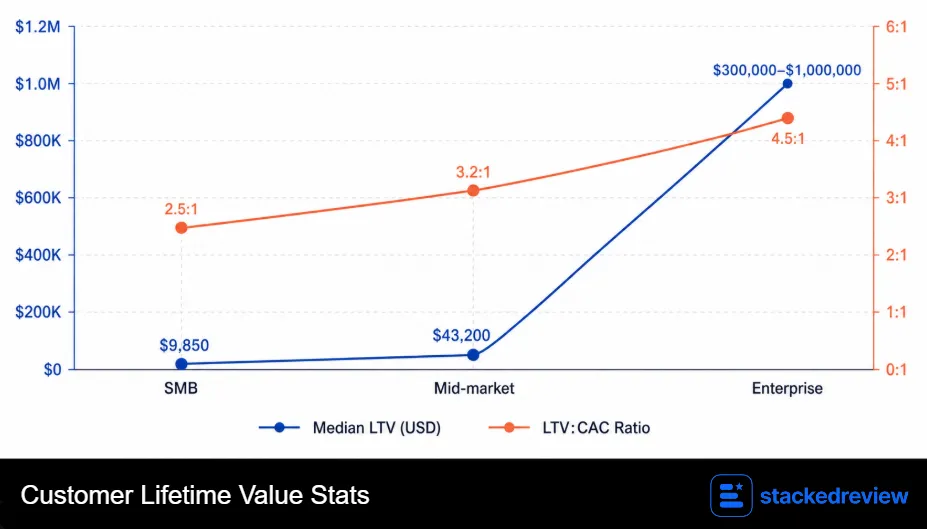
Segment drives everything. Mid-market SaaS median lifetime value now sits near $43,200, roughly 4.4 times the SMB median of about $9,850. Enterprise accounts can run from $300,000 into seven figures. The gap keeps widening, and pricing is not the reason. Retention is.
Mid-market accounts on multi-product contracts post around 116% net revenue retention, while single-product SMB lands near 102%. Expansion, not the sticker price, is what pulls the two cohorts apart.
| Segment | Median LTV 2026 | Typical LTV:CAC | Monthly logo churn |
|---|---|---|---|
| SMB (under $15K ACV) | $9,850 | 2.5 : 1 | 3% to 7% |
| Mid-market ($15K to $100K) | $43,200 | 3.2 : 1 | 1% to 1.3% |
| Enterprise ($100K+ ACV) | $300K to $1M+ | 4.5 : 1 | 0.5% to 1% |
| Cross-industry median | Varies by model | 3.4 : 1 | About 3.5% |
Lifetime value here is margin-adjusted, so it already accounts for the cost of serving the customer.
A Quick Caution From Us: We see a lot of decks quote lifetime value without the gross-margin haircut. That inflates the number and hides weak economics. A raw lifetime value figure with no margin applied is close to useless. Always read it next to acquisition cost, never on its own.
The LTV to CAC Ratio Everyone Argues About
Split lifetime value by acquisition cost and you get the ratio investors obsess over. The rule of thumb has held for years: 3:1 is healthy, below 3:1 is a warning, above 5:1 may mean you are under-spending on growth.
The 2026 median across industries sits at 3.4 to one. The top quartile has pulled away to 5.6 to one, and that gap has widened every year since 2023. Best-in-class operators compound retention gains while weaker teams absorb rising costs.
By segment the picture sharpens. Enterprise averages near 4.5:1 on long lifespans and strong expansion. Mid-market runs around 3.2:1. SMB lags at roughly 2.5:1 because churn eats value faster.
One thing we keep repeating to founders who read our reviews. The 3:1 rule came from mature public software firms with stable churn. The rule was never meant for pre-fit or seed-stage startups, yet people apply it everywhere. Match the target to your stage, not the headline.
CAC Payback Period: How Fast You Get the Money Back
Ratio tells you the size of the prize. Payback tells you the speed. The CAC payback period is the number of months of gross margin needed to earn back what you spent to win a customer.
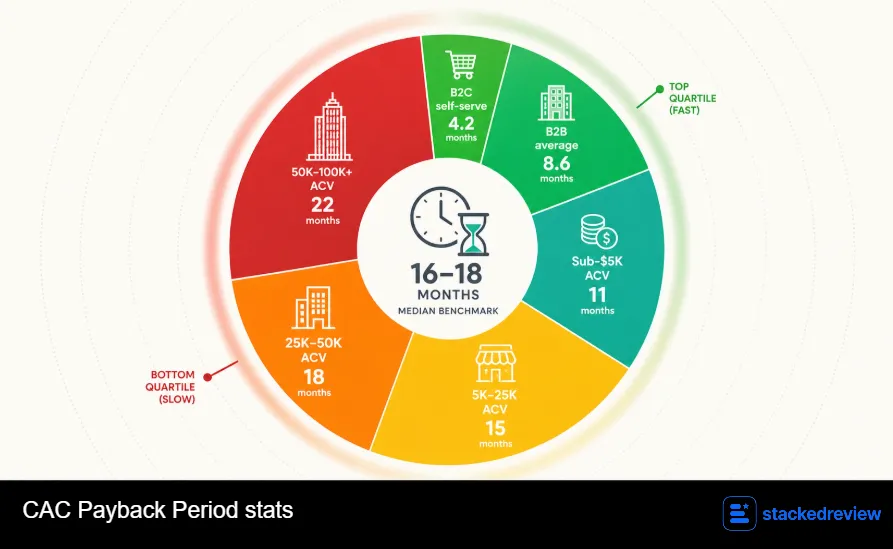
The median B2B SaaS company now recovers cost in about 16 to 18 months. That crept up from 14 to 15 months back in 2023. Top-quartile teams do the job in six months or fewer, and the bottom quartile takes 24 months or more.
Deal size shapes the curve more than anything else. Small, high-volume products recover fast. Big enterprise deals take longer because field sales costs pile up before the contract pays for itself.
| ACV tier / motion | Median payback | Top quartile | Bottom quartile |
|---|---|---|---|
| Sub-$5K ACV | 11 months | Under 6 months | Around 18 months |
| $5K to $25K ACV | 15 months | 7 months | 22 months |
| $25K to $50K ACV | 18 months | 10 months | 26 months |
| $50K to $100K ACV | 22 months | 15 months | 30 months+ |
| B2C self-serve | 4.2 months | Under 3 months | 9 months |
| B2B average | 8.6 months | Under 6 months | 18 months |
Aim to recover cost inside 18 months. Under 12 months marks a company that can fund its own growth.
StackedReview Projection: We expect median payback to hold near 17 months through 2026, then tick down toward 15 by late 2027. The reason is simple. AI productivity gains are finally offsetting paid cost inflation, and we see that split every week in the tools we test.
Churn and Retention: The Hidden Engine Behind LTV
Lifetime value lives or dies on retention. Lose customers fast and no acquisition budget can save you. So churn deserves its own seat at the table.
The net revenue retention median for private B2B SaaS sits near 101% to 106% in 2026, down from about 105% back in 2021. Enterprise holds strong near 118%, while SMB sits closer to 97%. Public SaaS leaders average around 114%.
Gross revenue retention, which strips out expansion, runs near 91% to 92% at the median. Churn splits hard by segment too. Enterprise loses 0.5% to 1% of logos a month, while SMB and self-serve can bleed 3% to 7%.
| Segment | Net revenue retention | Gross revenue retention | Monthly logo churn |
|---|---|---|---|
| SMB (under $25K ACV) | 97% | 88% to 90% | 3% to 7% |
| Mid-market | 101% to 106% | 91% to 92% | 1% to 1.3% |
| Enterprise ($100K+ ACV) | 118% | 94% to 97% | 0.5% to 1% |
| Top-quartile performers | 120% to 130%+ | 95% to 98% | Under 0.7% |
| Public SaaS median | 114% | Mid-90s | Under 1% |
The math punishes small churn. A 5% monthly loss wipes out about 46% of customers in a year. Push monthly churn to 2% and the average customer lifetime jumps to around 50 months. Drop churn further and lifetime value soars without a single extra ad dollar.
One quiet culprit hurts more teams than they admit. Failed payments, or involuntary churn, cause 20% to 40% of total losses. A decent dunning sequence recovers 30% to 70% of those charges. We rate that as one of the highest-return fixes in all of SaaS.
The AI Twist Nobody Priced In
Artificial intelligence is bending these numbers in two directions at once. On the acquisition side it helps. On the retention side it exposes a fresh risk.
Teams that adopted AI across marketing report acquisition savings of 30% to 47%. AI-assisted go-to-market cuts payback by three to five months versus firms that skipped it. Only about 15% to 20% of growth-stage SaaS run AI agents in lifecycle work today, so early movers hold a real edge.
The retention side worries us more. Budget-tier AI tools priced under $50 a month show just 23% gross revenue retention and 48% net revenue retention. Over half of that revenue churns in a year. Premium AI products above $250 a month hold near 70% gross retention. Cheap AI is a leaky bucket, and the data proves it.
What We’re Forecasting: We expect the AI efficiency gap to become the defining split of 2026 and 2027. Full-stack AI adopters will keep pulling acquisition cost down while everyone else pays 25% to 45% more for the same result. Adoption of AI agents in marketing should cross 40% by 2027 on current pace.
Trial Conversion and Expansion Revenue
How trials convert feeds straight into acquisition efficiency. The gap between self-serve and sales-assisted is stark.
Expansion revenue has quietly become the growth lever that matters most. Top-quartile firms above 110% net revenue retention grow about 2.3 times faster than peers stuck at 95% to 100%. Selling more to the customers you already have beats chasing new logos every time.
SaaS CAC by Industry Vertical: Not All Niches Cost the Same
Category matters almost as much as motion. A fintech buyer and an education buyer sit at opposite ends of the cost curve. We watch these gaps closely because they shape which niches we cover.
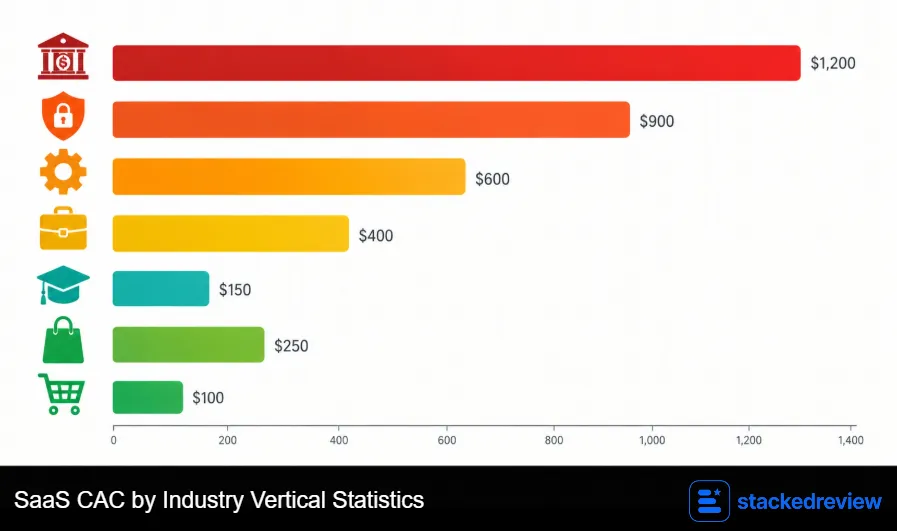
Regulated, high-stakes categories cost the most. Fintech SaaS averages near $1,450 per customer, while security tools run closer to $805. Enterprise-grade software lands in the $800 to $1,500 band once field sales enters the mix. Lighter categories sit far below.
The takeaway we push hardest: benchmark inside your own niche, never against the blended SaaS average. A $50,000 acquisition cost is a disaster for a $500 product and perfectly fine for a $200,000 enterprise deal.
Marketing Spend as a Share of Revenue
How much of the budget goes to growth shifts by funding and stage. The pattern holds year after year.
Early-stage SaaS firms spend roughly 10% to 15% of annual recurring revenue on marketing. The share compresses as brand recognition builds and word of mouth kicks in. Funding changes the math too. Equity-backed companies spend about 58% more on marketing than bootstrapped peers at the same stage.
The channel mix at the top is telling. Content and organic search now drive around 41% of qualified pipeline at the best-performing teams, while paid share slipped to 26% from 34% back in 2023. Buyers also decide earlier than most founders assume. Around 95% of purchases now come from a Day One shortlist, up from 85% a year prior.
Acquisition cost has climbed the priority list as a result. About 26% of marketing leaders now rank customer acquisition cost among their top five metrics, a sharp jump from a few years ago.
Our Number to Watch: We keep coming back to content share of pipeline. Teams that push organic and content past 40% of pipeline tend to hold the cleanest blended CAC in any category we review. Paid-heavy teams look great early, then watch payback stretch as auctions climb.
Our 2026 SaaS CAC & LTV Statistics, Projected Forward
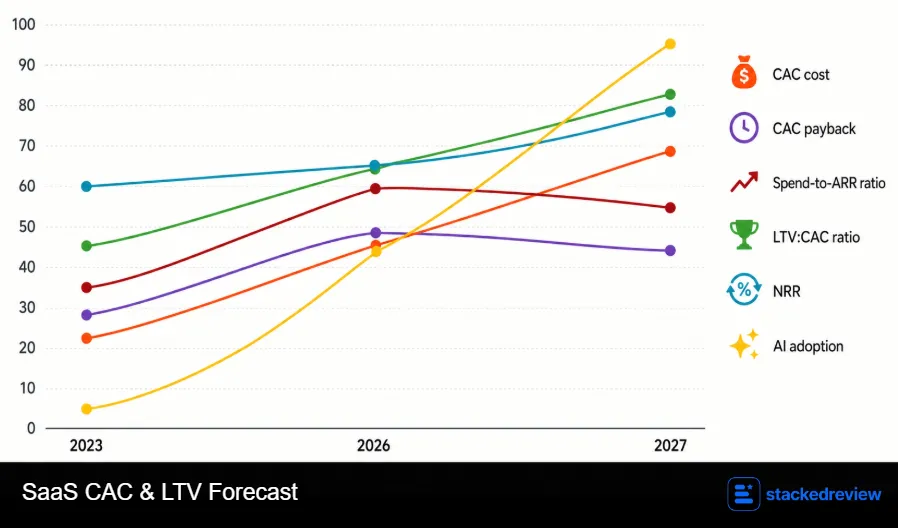
We pulled every benchmark above into one view, then added where we think each metric heads next. These forward figures are our estimates, built from the patterns we watch across the tools we review.
| Metric | 2023 | 2026 actual | Our 2027 projection |
|---|---|---|---|
| Blended B2B SaaS CAC | About $850 | About $1,200 | $1,250 to $1,300 |
| Spend to buy $1 of new ARR | $1.75 | $2.00 | $1.90 to $1.95 |
| Median CAC payback (months) | 14 | 16 to 18 | 15 to 16 |
| Cross-industry LTV:CAC | 3.0 : 1 | 3.4 : 1 | 3.5 to 3.7 : 1 |
| Median net revenue retention | 103% | 101% to 106% | 104% to 107% |
| AI adoption in go-to-market | Under 5% | 15% to 20% | 35% to 42% |
The 2023 and projection figures are StackedReview estimates. The 2026 actuals draw on the sources listed at the end.
The Number We’d Bet On: If we had to pick one metric to watch all year, it would be payback speed paired with retention. Those two together predict long-run health better than growth rate alone. Our best guess is that 2026 marks the turning point where AI-driven efficiency finally beats cost inflation for the teams that move first.
Quick Answers on SaaS Acquisition and Lifetime Value
Here are the questions founders send us most, answered plainly and backed by the 2026 data above.
What is a good SaaS CAC in 2026?
Most healthy B2B segments land between $300 and $800 per customer. Self-serve should aim for $200 to $600, while sales-led enterprise can justify $1,500 to $3,000 when the ratio holds above 3:1.
What is a healthy LTV to CAC ratio?
Target 3:1 as the floor and 5:1 as the sign of strong efficiency. Below 3:1 signals weak economics. Sitting far above 5:1 can mean you are under-investing in growth.
What counts as a good CAC payback period?
Aim to earn back acquisition cost inside 18 months. Under 12 months marks a company that can fund its own growth, and the top quartile now recovers cost in six months or fewer.
How much has SaaS CAC actually risen?
Acquisition cost has climbed about 222% over eight years and roughly 60% in the past five. Rising ad auctions, longer sales cycles, and bigger buying committees all pushed the number up.
What net revenue retention should I aim for?
Keep net revenue retention above 100% so existing customers grow revenue on their own. Enterprise-grade teams reach 118%, and the very best push past 130%.
Does AI really lower acquisition cost?
Yes, for the teams that adopt it fully. Full-stack AI users report 30% to 47% lower cost and payback three to five months shorter than firms that skipped it.
How We Built These SaaS CAC & LTV Statistics
We have run publishing and software analysis for years, and we review SaaS tools every single week. So we do not just repeat headline numbers. We cross-check them against what we watch inside the products themselves.
Every 2026 figure here was pulled from named primary benchmarks covering hundreds to thousands of real companies. We stripped out any half-year or partial-period slices and kept full-year reads only. Where we add a projection, we label it as ours, plainly.
Our goal with these SaaS CAC & LTV Statistics is simple. Give founders and operators a clean, honest picture they can plan around, with no inflated numbers and no borrowed hype. If a figure moves during the year, we come back and update the page.
Bottom Line From Us: Acquisition keeps getting pricier, retention decides who survives, and AI is quietly rewriting both. Aim for a 3:1 ratio or better, payback under 18 months, and net revenue retention above 100%. Hit those three and the rest of your SaaS economics tends to fall into place.
Sources and Further Reading
We drew on the benchmark reports below. Every link opens the publisher’s own data.
- Statista: Software and SaaS market data
- Gartner: Worldwide IT and software spending forecasts
- Benchmarkit: SaaS Performance Metrics benchmarks
- Bessemer Venture Partners: State of the Cloud and Cloud Index
- ChartMogul: SaaS retention and metrics reports
- Paddle and ProfitWell: Churn and pricing research
- ICONIQ Growth: SaaS growth and efficiency reports
- Recurly: Subscription churn benchmark reports
- Precedence Research: Global SaaS market size
- Maxio: SaaS retention and growth benchmarks

Affiliate Disclosure: This post may contain some affiliate links, which means we may receive a commission if you purchase something that we recommend at no additional cost for you (none whatsoever!)
Similar Posts



Verification process
Editorial standards
We’re a team of real users — not bots, not press-release copiers. Here’s exactly how we earn your trust on every single post.
We Actually Buy the Products
Every deal on this site is tested with a real purchase using our own accounts. We don’t rely on screenshots sent by vendors or press kits. If we say the discount works, we’ve clicked through checkout ourselves.
No Pay-to-Rank Policy
We never accept payment to feature or rank a deal higher. Affiliate commissions don’t influence our editorial scores — a bad deal stays ranked low regardless of commission size.
Monthly Re-Verification
Pricing changes fast. Our team re-tests every published deal at least once a month and immediately updates or removes any that have expired, changed, or been capped.
Expert Editorial Team
Our writers and editors have collectively spent 40,000+ hours hands-on with digital tools. We know what a fair price looks like — and we call out bad deals even when they’d earn us commissions.
Transparent Scoring Criteria
Every score is calculated from a public rubric: discount value, feature-to-price ratio, redemption ease, plan flexibility, and competitor comparison. No hidden weighting, ever.
Reader Feedback Loop
Thousands of readers report broken deals each month. Our team investigates every report within 24 hours and updates the page the same day a deal stops working.
Jaclyn Donaldson
Jaclyn is a content strategist at StackedReview with a passion for empowering small businesses. She specializes in dissecting social media advertising costs and hunting down the best-value deals. Her goal is to help brands stretch their budget further without compromising on results.