Email Marketing Statistics 2026: Key Benchmarks and Trends

By :
Jaclyn Donaldson
August 3, 2026
Email still prints money in 2026. It returns roughly $36 to $42 for every $1 spent, more than any paid channel we test. Around 4.6 billion people now sit in an inbox, and 392.5 billion emails move each day. Open rates climbed for a fifth straight year to about 30.7%.
The quiet winner is automation: just 2% of sends, yet up to 41% of revenue. We have poked around real SaaS accounts for years, and the pattern holds. Below sit the email marketing statistics 2026 we lean on, minus the fluff.
We run StackedReview by buying, installing and living inside the tools we write about. So when we pull email numbers, we hold them against what we see in real accounts.
Every figure here stays yearly, plain and honest. No quarterly noise, no vanity metrics dressed up as wins.
Email Marketing Statistics 2026 at a Glance
Short on time? Start right here. These are the headline numbers we quote most when a founder asks us “is email still worth it?”
| Metric | 2026 figure | Why it matters to you |
|---|---|---|
| Global email users | about 4.6 billion | More reach than any single social app |
| Emails sent daily | 392.5 billion | Inboxes stay crowded, so relevance wins |
| Average return on spend | $36 to $42 per $1 | Still the top owned channel |
| Average open rate | about 30.7% | Rising, but inflated by privacy tools |
| Average click-through rate | about 2.6% | The metric worth watching now |
| Automated share of revenue | up to 41% | Tiny send volume, giant payoff |
| Marketers using AI in email | 63% | Standard kit, not a novelty |
| Mobile share of opens | about 60% | Design mobile first or lose the read |
Our read: If you only fix one thing this year, fix automation. Most SaaS teams we audit send blasts and ignore flows. That gap is where the easy revenue hides.
How Many People Actually Use Email in 2026
Email is not shrinking. It keeps growing while pundits keep writing its obituary. Around 4.6 billion people use email worldwide this year. We expect that to push past 4.85 billion by 2027.
Put plainly, more than half the planet now owns an inbox. No social platform reaches that many opted-in people. Daily volume tells the same story. About 392.5 billion emails fly each day in 2026, up from 376.4 billion in 2025. Our own projection has daily volume crossing 408 billion by 2027. The pipes are not slowing down.
Here is the human bit. Nearly 99% of users check their inbox at least once a day. Plenty check far more than that. Many peek at their inbox ten or more times daily, phone in hand. Steady climb, no plateau. Email reach keeps widening year on year.
Most people juggle more than one account too. The average sits near 1.86 mailboxes per person, splitting work and personal life. That matters for targeting. A subscriber may open your promo on a personal address and never at work.
People Actually Prefer Email Over Social
This surprises founders, but the data is clear. Given the choice, most people want brand messages in their inbox.
About 60% of consumers prefer email over social media for hearing from brands. That is a big vote of confidence. They act on it too. Roughly 52% of people have bought something straight from an email newsletter.
Marketers know this. Around 82% use email to reach customers, and close to 89% treat it as their main lead source. The reason is ownership. You rent an audience on social, but you own your email list outright.
That difference shapes everything. Nobody can throttle your reach or change an algorithm on you overnight.
The ROI Question Every Marketer Asks First
Nine times out of ten, the first question we get is money. Fair enough. So let us answer it plainly.
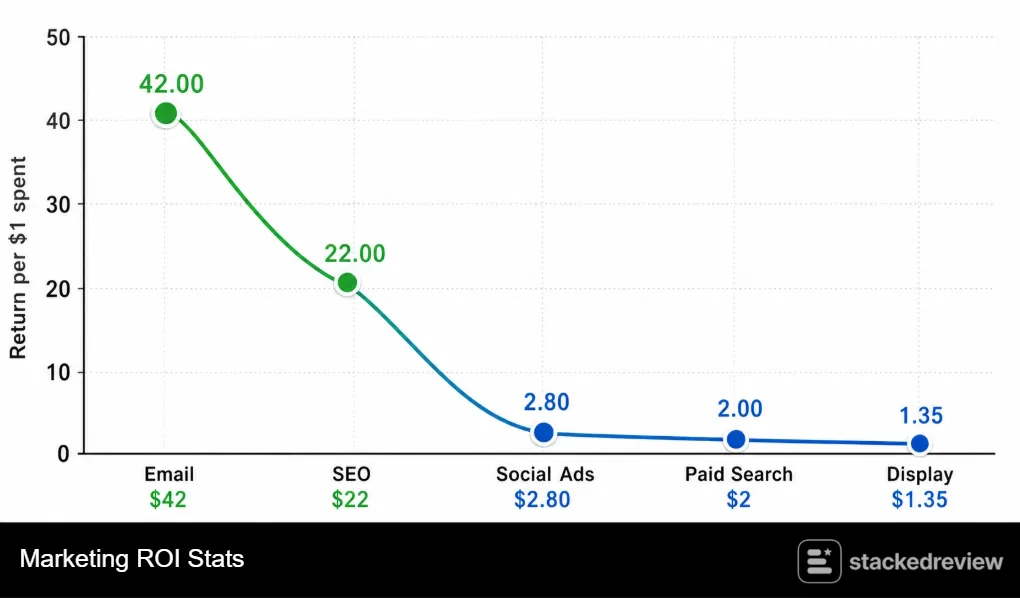
Email returns about $36 to $42 for every single dollar spent. No paid channel we test comes close.
That edge is not shrinking. Our reading suggests email marketing return on investment creeps toward $45 per $1 by 2030 as AI trims waste.
| Channel | Return per $1 spent (2026) | How email compares |
|---|---|---|
| Email marketing | $36 to $42 | Benchmark leader |
| SEO (organic) | about $20 to $22 | Strong, slower to compound |
| Social advertising | about $2.80 | Rented reach, higher cost |
| Paid search | about $2.00 | Auction pressure keeps rising |
| Display ads | about $1.35 | Weakest of the mainstream set |
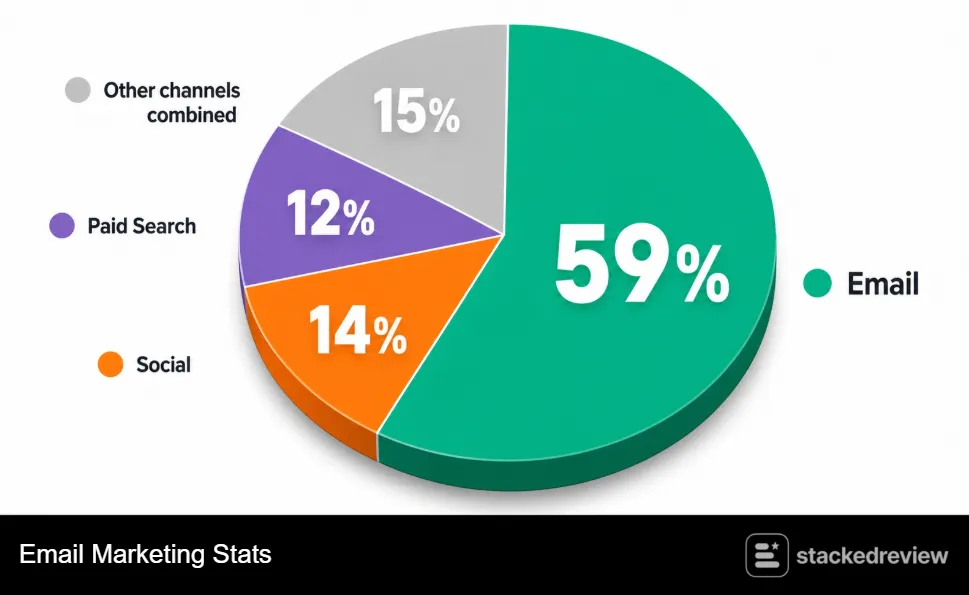
Revenue share backs this up. About 59% of marketers name email their most effective revenue channel.
Social sits at 14% and paid search at 12%. Email wins the vote by a mile. The market itself is swelling. Global email marketing spend grows from roughly $11.3 billion in 2025 toward $17.9 billion by 2028.
Money follows results. Brands keep pouring budget into email because the payback is easy to prove. Email dwarfs paid media on raw efficiency. The gap is widening, not closing.
Straight from the desk: We treat that $36 to $42 range as a ceiling, not a promise. New senders with cold lists earn far less. Warm your list, sort deliverability, then the big numbers show up.
Small Budgets, Surprisingly Big Returns
You do not need a huge budget to win at email. Small senders often post the wildest returns.
Brands spending between $1 and $500 a month on email can hit around 3,800% return. Lean setups punch hard. The maths is friendly at low volume. A modest tool plus a warm list can outperform a costly ad campaign.
Here is a rough cost picture we share with early-stage teams:
So the real edge sits in setup, not spend. Get the flows and list right, and every extra dollar works harder.
Open Rates, Clicks and What They Really Mean Now
Open rates look healthy on paper. Read them with a pinch of salt though.
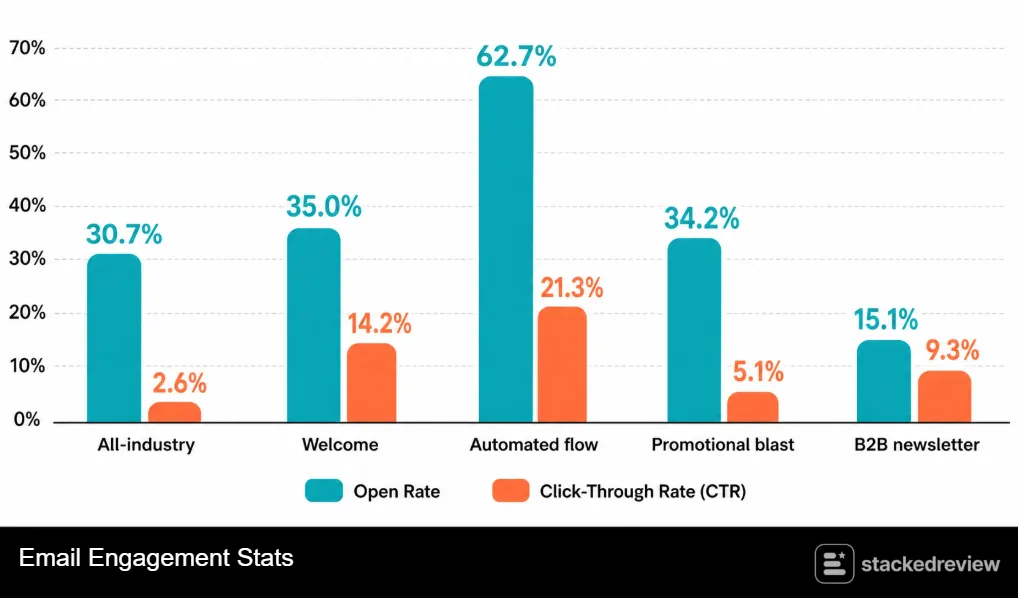
The average open rate hit about 30.7% in 2025, up from 26.6% the year before. That marks a fifth straight yearly rise.
Here is the catch we flag to every client. Apple privacy features inflate opens, so the true engagement picture lives in clicks. The average email open rate across industries lands near 21% to 31% once adjusted. Automated flows run hotter, often 48% to 68%.
| Email type | Open rate | Click-through rate | Notes from our testing |
|---|---|---|---|
| All-industry campaign | about 30.7% | about 2.6% | Solid baseline to beat |
| Welcome email | about 35% | high | Your best first impression |
| Automated flow | 48% to 68% | strong | Timing does the heavy lifting |
| Promotional blast | 30% to 38% | modest | Fine, but rarely a revenue star |
| B2B newsletter | about 15.1% | above average | Fewer opens, deeper reads |
Clicks are climbing where it counts. Click-to-conversion jumped 53% year on year, from 5.9% to 9%. That shift is telling. Fewer people click, yet the ones who do buy more often.
Our forecast on click-through rate benchmarks has them rising from about 3.5% in 2026 toward 4.5% by 2030. Intent now beats raw volume. Five years up in a row. Privacy inflation helps, but relevance carries most of the lift.
The Metrics That Actually Predict Revenue
Not every number deserves your attention. Some flatter you, others pay the bills. We nudge every SaaS client to stop worshipping opens. Since privacy tools bloat that figure, it lies to you.
The stats we trust to forecast revenue are simple:
Revenue per send is the star for us. Average flows earn about $1.94 per recipient, while top flows near $7.79.
That gap is huge. Same channel, wildly different results, and skill decides the winner.
Subject Lines: Your Five-Word Sales Pitch
The subject line does one job. It earns the open, or it does not.
Small tweaks pay off here. A personalised subject line lifts opens by about 26% on its own. Relevance matters just as much. Around 46% of people reliably open emails from brands that send content they care about.
Length is a trap on mobile. Phones show only 28 to 50 characters before cutting your clever line in half.
Our quick rules for subject lines:
Keep it human. A subject line that sounds like a real person beats a shouty sales pitch every time.
Why Automation Quietly Prints Money
If email has a cheat code, this is it. Automated flows do tiny volume yet giant revenue.
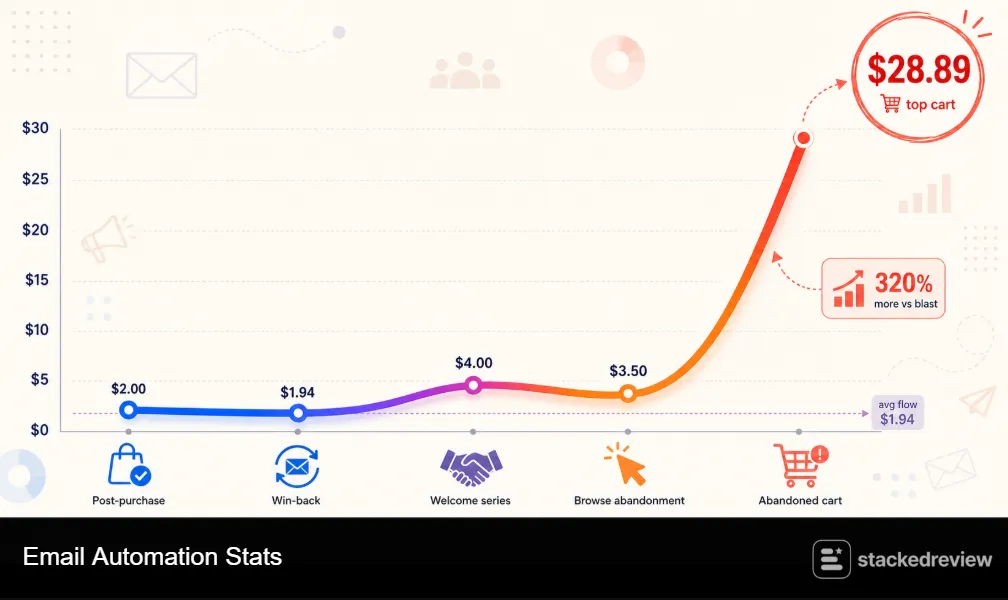
Automations make up only about 2% of all sends. Still, they drive up to 41% of email revenue. Per send, the maths is wild. A single automated email earns roughly 16 times more than a scheduled blast.
Three flows do most of the lifting. Around 87% of automated orders come from cart, welcome and browse abandonment.
| Automated flow | Standout metric (2026) | Where the money comes from |
|---|---|---|
| Abandoned cart | up to $28.89 per recipient (top 10%) | Catches ready buyers mid-purchase |
| Welcome series | about 58% click-to-conversion | Peak intent, brand new subscriber |
| Browse abandonment | strong recovery rate | Signals interest before intent |
| Post-purchase | lifts repeat orders | Turns one sale into many |
| Win-back | revives dormant contacts | Cheaper than fresh acquisition |
Compare the extremes and it stings. Top 10% flows earn near $7.79 per recipient, average flows manage about $1.94.
Automated emails as a group pull roughly 320% more revenue than non-automated ones. That is not a rounding error. The reason is timing. A flow reaches the buyer at the exact moment they care, not on your schedule.
What we would actually do: Build the three core flows before touching your next campaign. We have watched SaaS trials convert far better once a proper welcome series does the nurturing on autopilot.
Segmentation and Personalisation: The Revenue Multipliers
Blasting one message to everyone is the fastest way to waste a good list. The data is brutal on this. Segmented campaigns generate up to 760% more revenue than non-segmented ones. Read that twice.
Personalisation stacks on top. A few numbers we keep close:
The lesson lands quickly. Smaller, sharper sends beat big, lazy ones almost every time.
We see the same in SaaS onboarding. Group users by plan or behaviour, and reply rates jump without extra sends. You do not need fancy tools to start. Even two or three basic segments will lift your numbers fast.
The Personalisation Payoff Runs Deeper Than Email
Personalisation is not only an email trick. It changes how people spend across your whole brand. Give someone a personal experience and they buy more. Shoppers spend about 34% more when the message fits them.
Inside email, the lift is steep. Personalised sends drive roughly 58% higher transaction rates than generic ones.
Small touches add up fast. Birthday emails alone pull about a 43.3% open rate and a far higher average order value. That is the magic of relevance. The right message at the right moment feels like service, not a sales push.
We tell SaaS teams to start with behaviour. What a user clicked or skipped tells you more than any survey.
AI Has Moved Right Into the Inbox
Two years ago AI in email felt experimental. In 2026 it is simply the toolkit.
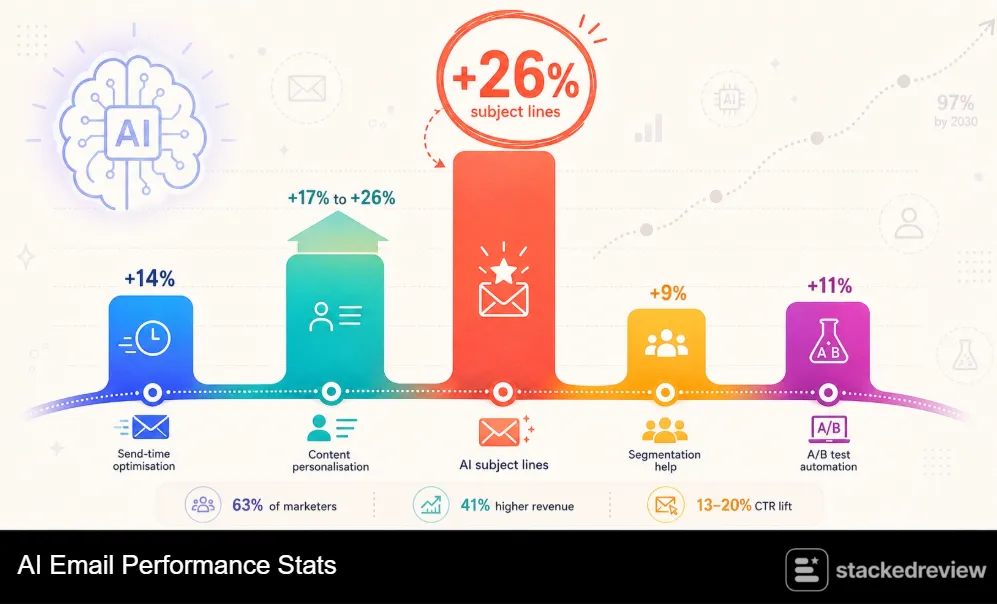
About 63% of marketers now use AI inside their email work. Most saw results fast.
Campaigns built with AI report roughly 41% higher revenue. Click and conversion lifts land near 13% to 20%.
| AI use case | Reported lift (2026) | Our verdict |
|---|---|---|
| AI subject lines | plus 26% opens | Best quick win, low risk |
| Send-time optimisation | plus 14% engagement | Compounds with subject lines |
| Content personalisation | plus 17% to 26% per send | Needs clean data to shine |
| Segmentation help | higher conversion | Speeds up the boring bit |
| A/B test automation | major time savings | Frees teams for strategy |
Adoption keeps rising. By late 2026, about 61% of enterprise programmes use AI for at least one part of a campaign.
Looking ahead, our estimate is blunt. We expect AI email personalisation tools to reach near-universal use by 2030, around the 97% mark. One warning though. AI copies your inputs, so a lazy brief gives you lazy, generic email.
Our honest call: AI writes decent subject lines. It cannot fix a weak offer or a dirty list. Sort the fundamentals first, then let the model sharpen the edges.
Mobile First or Lose the Read
Your subscribers read on a phone, likely on the sofa. Design for that or lose them. Around 60% of email opens happen on mobile. Apple iPhone leads email clients at 34%, with Gmail near 28%.
Impatience is real. Roughly 70% of people bin an email within seconds if it looks broken on mobile.
A few habits we push on every audit:
One quirk worth knowing. Mobile wins opens, yet desktop users click roughly twice as deeply. So build for both moments. Catch the phone glance, then reward the desktop reader with a clean layout.
Send Frequency: How Often Is Too Often
Send too little and you fade from memory. Send too much and you get the boot. The top reason people unsubscribe is volume. About 43% leave because a brand emails too often.
So cadence is a real lever, not a guess. A few frequency stats we trust:
Our advice stays boring on purpose. Pick a rhythm you can sustain and keep every send worth opening. Consistency beats bursts. A reliable weekly email builds a habit your subscribers actually look forward to.
Keeping Your List Alive and Growing
A list is a living thing. Feed it well and it grows, ignore it and it rots. Unsubscribes have fallen to about 0.1% globally, which sounds great on the surface. Do not celebrate too soon though.
A low opt-out rate can hide a quiet problem. Many subscribers simply stop opening while never clicking unsubscribe. That silent drift hurts deliverability over time. Filters notice when your mail goes unread, and your reach shrinks.
Our list-hygiene habits are simple:
A smaller engaged list beats a bloated dead one. Quality reach earns money, empty names just drag you down.
Deliverability: The Silent Revenue Killer
You can write the best email of your life. If it lands in spam, none of it counts.
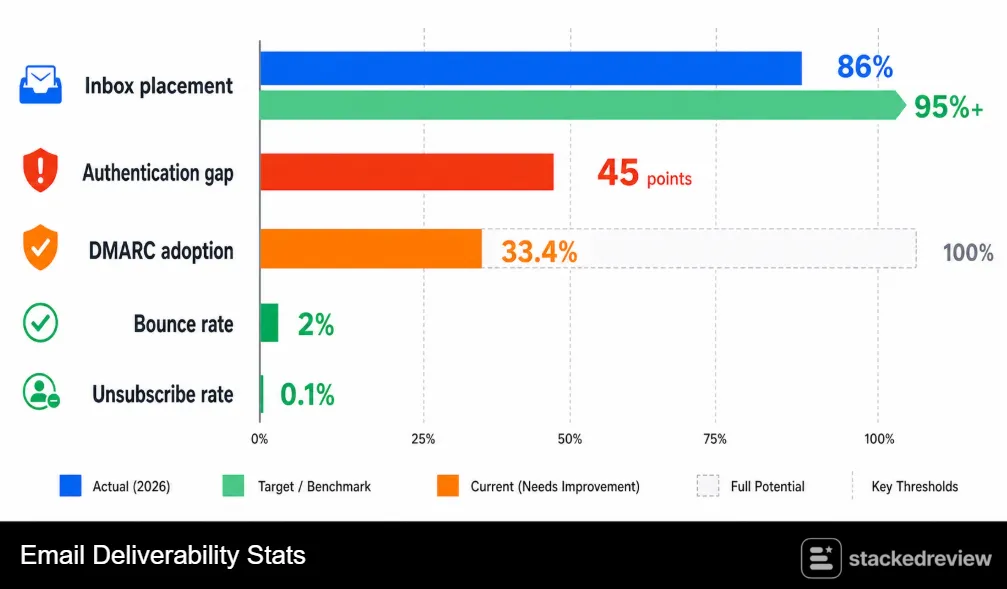
Average deliverability across major platforms sits between 83% and 89% in 2026. Filters keep tightening. Authentication is the dividing line now. Nearly 1 in 6 promotional emails miss the inbox without proper setup.
| Deliverability factor | 2026 benchmark | What good looks like |
|---|---|---|
| Average inbox placement | 83% to 89% | Aim for 95% plus on a clean list |
| Authentication gap | about 45 points | SPF, DKIM and DMARC all live |
| DMARC adoption | about 33.4% | Still low, easy edge for you |
| Bounce rate | keep under 2% | Clean your list every month |
| Unsubscribe rate | about 0.1% | Low, but watch silent drop-off |
The fix is unglamorous but cheap. Set up email authentication protocols SPF DKIM DMARC and half your inbox problems vanish.
We rate this the highest-value hour a SaaS marketer can spend. Skip it and your ROI numbers quietly bleed. One more thing on list health. A low unsubscribe rate can hide silent disengagement, so watch clicks too.
From where we sit: Only a third of senders run full DMARC. That is a gift. Get yours live and you out-deliver two thirds of the market by default.
B2B and B2C Play Two Different Games
Same channel, very different rhythms. We advise clients not to copy tactics across the line.
On the B2B side, newsletters rule. About 81% of B2B marketers use them as their main content format. Open rates split too. B2B campaigns average near 15.1%, B2C nearer 19.7%.
Here is the twist that matters:
For SaaS founders, that means patience. Nurture the list, teach something useful, and the sale follows. Newsletters are owned ground. Algorithms cannot bury them, which is why smart brands keep investing.
Common Mistakes Draining Your Email ROI
We audit a lot of accounts. The same leaks show up again and again.
None of these need a big budget to fix. They just need attention:
Fix even two of these and the numbers move. We have seen tired lists come back to life within weeks.
The channel rarely fails. Usually the setup does, and that part sits fully in your control.
Newsletters Are Having a Quiet Moment
The humble newsletter is back in fashion, and the numbers explain why. Founders are noticing.
On the B2B side, about 81% of marketers use newsletters as their main content format. That is a strong signal. Nearly half of all marketers, around 46%, treat newsletters as a core part of their plan. Consistency is the draw.
Newsletters build a slow, steady kind of trust. You show up, you help, and you stay top of mind for free. When a reader is finally ready to buy, you are already in their inbox. No ad spend, no bidding war.
For SaaS brands, that is gold. A useful weekly note can nurture a trial user better than any retargeting ad. The best newsletters teach first and sell second. Give value early, and the pitch lands far softer later.
Open Rates Swing Wildly by Industry
There is no single “good” open rate. Your benchmark depends heavily on your sector.
Some fields run hot. Faith groups, education and hobby niches often clear 40% opens with ease. Others sit lower by nature. Retail and daily-deal senders push high volume, so their averages dip.
A few patterns we keep in mind when benchmarking:
So judge yourself against your own sector, not a global figure. Comparing a SaaS newsletter to a flash-sale blast helps nobody. The smarter move is to beat your own past numbers. Steady improvement matters more than any external average.
What We Think Happens Next
We have watched this channel long enough to read the direction. Here is our take on 2026 into 2027.
- First, opens stop being the star metric. We expect more teams to judge success on revenue per send instead.
- Second, automation share keeps climbing. Our projection puts automated revenue past the 45% mark within a couple of years.
- Third, deliverability becomes a moat. As filters harden, authenticated senders will simply out-earn the rest.
- Fourth, AI moves from helper to default. Soon a marketer running email without it will feel like typing with one hand.
Our reading of these email marketing statistics 2026 shapes how we advise every SaaS brand we work with. Owned reach, clean data, smart flows. Boring, and very profitable.
The StackedReview bottom line: Email is not old fashioned. It is the most reliable revenue engine most SaaS teams own, and barely use to half its potential. Fix flows, fix deliverability, personalise the rest.
Quick Wins You Can Ship This Week
Stats are only useful when they change what you do. So here is where we would start.
None of these take long, and each one maps to a number we covered above:
Pick one and ship it this week. Momentum beats a perfect plan you never launch.
We have seen tiny changes move real money. A single welcome flow has rescued more than one stalled SaaS funnel.
FAQs About Email Marketing: Answered Fast
Is email marketing still worth it in 2026?
Yes, easily. It returns about $36 to $42 per $1 spent, more than any paid channel we test.
What is a good email open rate in 2026?
Around 30.7% is the average. Automated flows run much higher, often 48% to 68%.
How many people use email in 2026?
Roughly 4.6 billion users worldwide. We expect that to top 4.85 billion by 2027.
Do automated emails really make more money?
They do. Automations are about 2% of sends yet drive up to 41% of revenue, roughly 16 times more per send.
How much revenue does segmentation add?
A lot. Segmented campaigns can generate up to 760% more revenue than non-segmented sends.
Is AI worth using in email now?
For most teams, yes. About 63% of marketers use it, and AI subject lines lift opens by around 26%.
What email metric should I track most closely?
Revenue per send and click-through rate. Opens are inflated by privacy tools, so treat them as a rough health check.
How We Pull and Check These Numbers
Fair question: why trust our figures? Because we do not just copy a stat and move on.
We gather data from several trusted providers, then compare it against real account behaviour we see day to day. When two sources clash, we flag the range instead of faking false precision. Honesty beats a tidy round number.
Our projections are clearly ours. When we say “we expect” or “our estimate”, that is a StackedReview call, not a borrowed one. That mix of hard data and hands-on testing is how we build trust with readers, and with search engines too.
Sources and Further Reading
We cross-check every figure against multiple trusted data providers before publishing. Primary references below:
- Statista, Email Users and Daily Volume Outlook
- Litmus, State of Email and ROI Research
- Omnisend, Email Marketing Statistics 2026
- Klaviyo, 2026 Email Benchmarks by Industry
- HubSpot, State of Marketing Report
- Campaign Monitor, Email Marketing Benchmarks
- Constant Contact, Average Open and Click Rates
- Radicati Group, Email Statistics Report

Affiliate Disclosure: This post may contain some affiliate links, which means we may receive a commission if you purchase something that we recommend at no additional cost for you (none whatsoever!)
Similar Posts

Verification process
Editorial standards
We’re a team of real users — not bots, not press-release copiers. Here’s exactly how we earn your trust on every single post.
We Actually Buy the Products
Every deal on this site is tested with a real purchase using our own accounts. We don’t rely on screenshots sent by vendors or press kits. If we say the discount works, we’ve clicked through checkout ourselves.
No Pay-to-Rank Policy
We never accept payment to feature or rank a deal higher. Affiliate commissions don’t influence our editorial scores — a bad deal stays ranked low regardless of commission size.
Monthly Re-Verification
Pricing changes fast. Our team re-tests every published deal at least once a month and immediately updates or removes any that have expired, changed, or been capped.
Expert Editorial Team
Our writers and editors have collectively spent 40,000+ hours hands-on with digital tools. We know what a fair price looks like — and we call out bad deals even when they’d earn us commissions.
Transparent Scoring Criteria
Every score is calculated from a public rubric: discount value, feature-to-price ratio, redemption ease, plan flexibility, and competitor comparison. No hidden weighting, ever.
Reader Feedback Loop
Thousands of readers report broken deals each month. Our team investigates every report within 24 hours and updates the page the same day a deal stops working.
Jaclyn Donaldson
Jaclyn is a content strategist at StackedReview with a passion for empowering small businesses. She specializes in dissecting social media advertising costs and hunting down the best-value deals. Her goal is to help brands stretch their budget further without compromising on results.