
SaaS Pricing Statistics: 40+ Data Points for 2026 Budgets

By :
Jaclyn Donaldson
July 22, 2026
SaaS prices climbed about 12% in 2025, running roughly five times faster than general inflation. The per-seat model that ruled the last decade is fading fast.
Hybrid pricing now sits at 43% adoption and looks set to reach 61% by the close of 2026. AI is the biggest reason bills keep growing, with 62% of platforms adding AI premium tiers.
At StackedReview, we track pricing pages, renewal quotes and real invoices every month. So these SaaS Pricing Statistics come from what we watch land on actual bills, not guesswork.
We have pulled together the numbers that shape software budgets in 2026. Short, clear, and built for marketers who buy tools for a living.
How Big Is The SaaS Market In 2026?
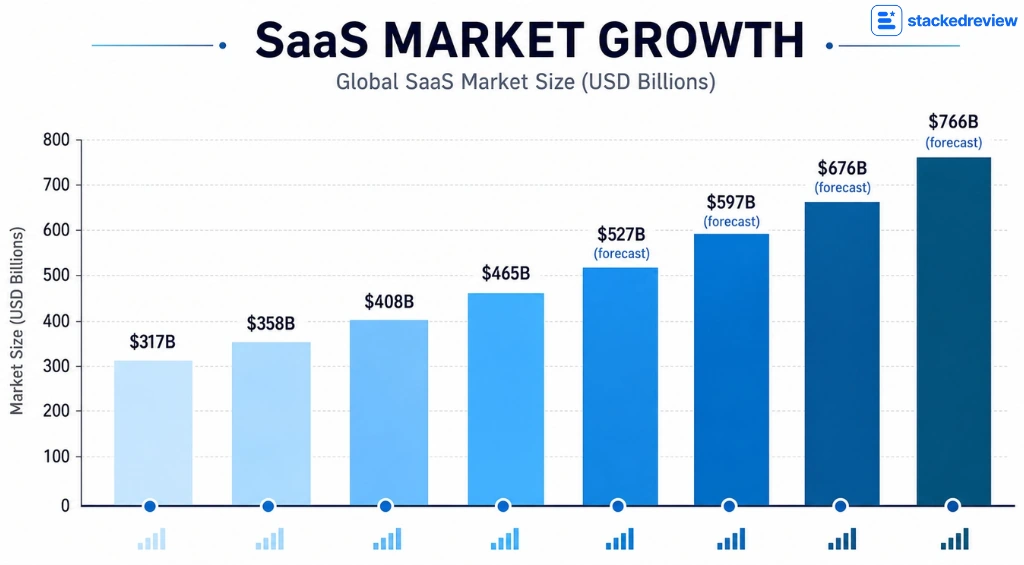
The global SaaS market reached about $408 billion in 2025. Our read of the major trackers puts 2026 near $465 billion.
That works out at roughly 14% growth in a single year. Software is now the fastest-moving slice of IT spend.
Gartner expects worldwide software spending to hit $1.44 trillion in 2026, up 15.1% on the year. SaaS takes the largest share of that pot.
Here is how market size stacks up year on year. The later figures are our forward view, built on a steady 13% growth rate.
| Year | Global SaaS market size |
|---|---|
| 2023 | $317 billion |
| 2024 | $358 billion |
| 2025 | $408 billion |
| 2026 | $465 billion |
| 2027 | $527 billion (our forecast) |
| 2028 | $597 billion (our forecast) |
| 2029 | $676 billion (our forecast) |
| 2030 | $766 billion (our forecast) |
At StackedReview, we reckon the $1 trillion mark arrives before 2034. Prices, not just new logos, are doing plenty of the heavy lifting here.
The growth story is not slowing either. Gartner has revised its 2026 software forecast up three times in six months.
Software now grows faster than almost every other IT category. Anything below 15% growth means a vendor is losing share.
Two forces sit behind the numbers. First, more firms move off on-premise kit. Second, AI features push every renewal higher.
What Do SaaS Companies Actually Charge For?
Pricing pages look busy in 2026. Most vendors now blend more than one method on a single plan.
Tiered “good, better, best” packaging still leads the pack. Around 67% of SaaS firms build on it as their base.
But the seat model keeps shrinking. Pure per-seat pricing fell from 21% to 15% in a year.
| Pricing model | Share of SaaS companies | Direction |
|---|---|---|
| Tiered (good, better, best) | 67% | Steady |
| Hybrid (base plus usage or outcome) | 43% | Rising fast |
| Some usage-based element | 38% | Rising |
| Flat-rate subscription | 22% | Falling |
| Pure per-seat | 15% | Falling |
| Outcome-based element (enterprise) | 40% | Rising |
One quick note on the maths. These add up past 100% on purpose. Most firms now mix two or three methods on the same plan.
We rarely review a serious tool now without a base fee plus a usage meter sitting on top. The single-metric pricing page is on its way out.
The Move To Usage-Based And Hybrid Pricing
Here is the shift that defines 2026. Software is moving from charging for access to charging for use.
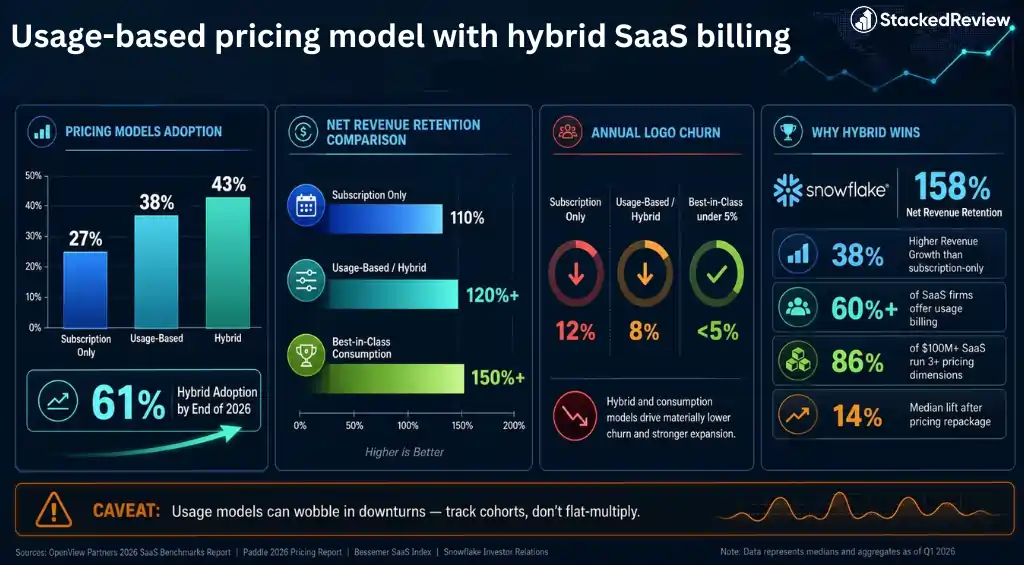
Usage-based pricing models now cover 38% of SaaS companies. That figure sat at 27% back in 2021.
Hybrid is the real winner though. It pairs a steady base fee with a usage or outcome meter.
Why does hybrid keep winning? Money. The retention numbers are hard to argue with.
Net revenue retention rate climbs when usage enters the mix. Customers grow their bill by using more, not by signing a fresh contract.
| Pricing approach | Median net revenue retention | Annual logo churn |
|---|---|---|
| Subscription only | 110% | 12% |
| Usage-based or hybrid | 120% and up | 8% |
| Best-in-class consumption | 150% and up | Under 5% |
Snowflake is the poster child here. Its pure consumption model helped it reach 158% net revenue retention, one of the highest in public SaaS.
We have watched this play out across the tools we review. The ones with a smart usage meter keep growing accounts quietly, month after month.
A well-run pricing change pays off quickly too. Firms that repackage well see a 14% median lift in net dollar retention.
Bigger firms take it further. Among SaaS companies above $100 million in value, 86% now run at least three pricing dimensions on a single plan.
There is a catch worth flagging. Usage models can wobble in a downturn, since customers simply use less. So forecasting needs cohort tracking, not a flat monthly multiply.
AI Is Rewriting SaaS Price Tags
AI is the loudest force on pricing right now. It carries real compute cost, so vendors charge for it on its own.
AI premium pricing tiers landed on 62% of SaaS platforms in 2026. Buyers now budget 25% to 35% more when they bolt AI onto an existing stack.
Roughly 41% of all SaaS companies formally charge for AI today. The rest are racing to catch up.
Now the strange part. Token prices dropped 80% in a year, yet total AI spend still grew 320%.
Cheaper units, far higher volume. That combination is quietly reshaping every AI bill in the market.
A mid-market CRM that cost $50,000 a year can now run $75,000 to $90,000 once the AI tier goes live. Same seats, bigger invoice.
Giving AI away inside a flat plan wrecks margins. We expect more vendors to wall AI behind credits or a separate meter through 2026.
Big names moved fast in early 2026. Several household SaaS brands reworked their AI pricing within months of each other.
The pattern is clear. AI value and AI cost now sit in separate buckets on the bill. Buyers get a base fee they can forecast, plus a meter that scales with real use.
Credit-Based Pricing And The New AI Meter
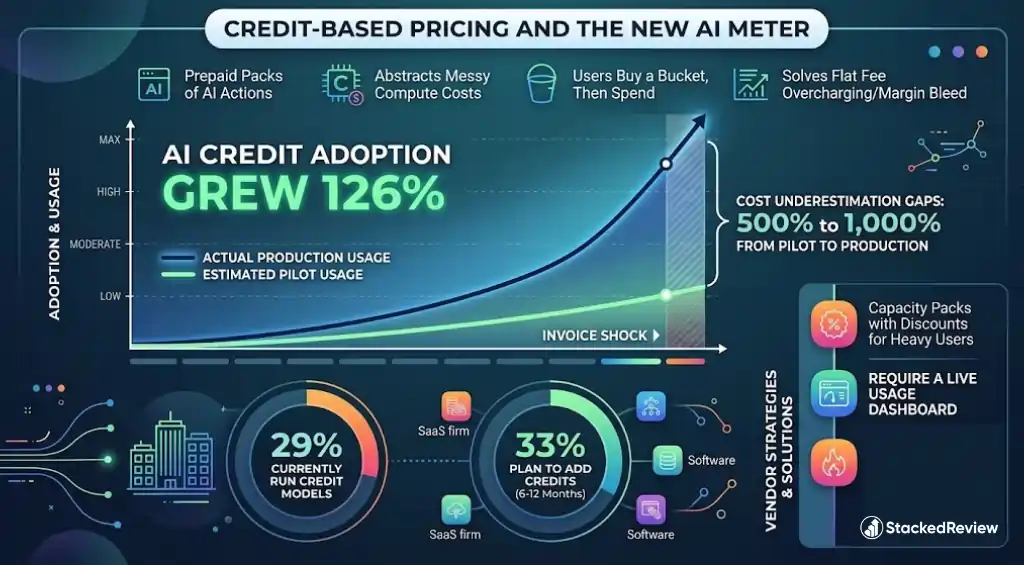
Credits are the fastest-spreading billing unit in 2026. They turn messy compute costs into tidy, prepaid packs.
Consumption-based billing models now lean heavily on credits. A user buys a bucket, then spends it on AI actions.
Credits solve a real problem. AI costs jump around, so a flat fee either overcharges light users or bleeds margin on heavy ones.
But credits carry a warning label. Pilot bills often understate the real cost of scaling up.
Some AI tools show cost underestimation of 500% to 1,000% once a team moves from pilot to production. That gap is where invoice shock lives.
We push every vendor for a live usage dashboard before we recommend a credit plan. If you cannot see your burn rate, you cannot control your bill.
Outcome-Based Pricing: Paying For Results, Not Seats
A newer model keeps picking up speed. Vendors charge per result, not per login.
Gartner expects 40% of enterprise SaaS to carry outcome-based elements by 2026. That share sat at just 15% two years earlier.
Real examples make the shift clear:
Some vendors now price AI agents like staff. Monthly fees of $800 to $2,000 per agent are common, sold as a swap for a salary.
Outcome-based pricing models help retention too. Firms using them report 31% higher customer retention and 21% higher satisfaction.
We like outcome pricing when the vendor can prove the result. When they cannot, it turns into a guessing game on your invoice.
How Fast Are SaaS Prices Rising In 2026?
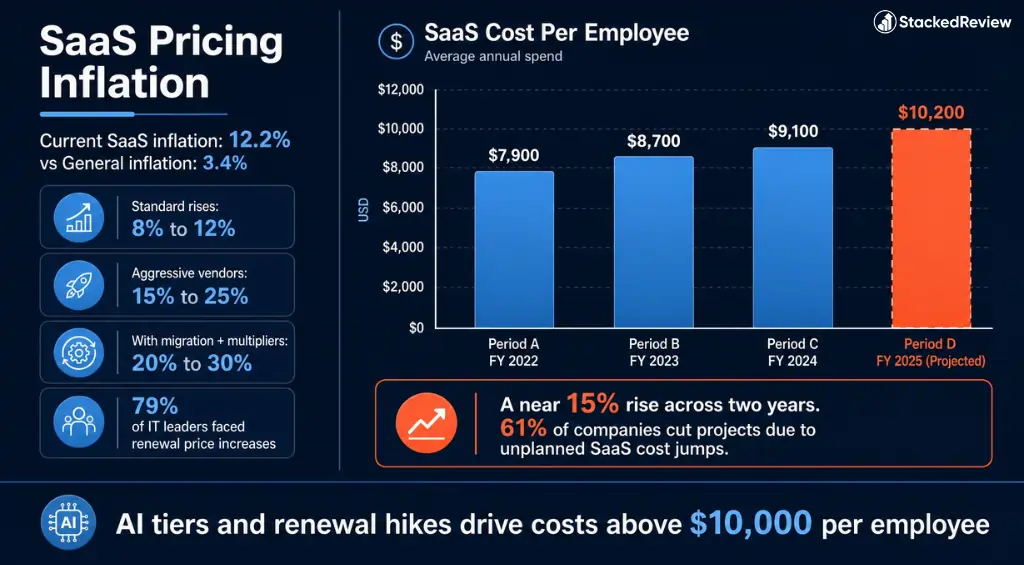
Bluntly, faster than most budgets planned for. The SaaS price increase rate now sits well ahead of general inflation.
Current SaaS inflation runs at about 12.2%. General market inflation sits far below that mark.
The per-employee figure tells the story best. Software spend per head keeps climbing.
| Year | SaaS cost per employee |
|---|---|
| 2023 | $7,900 |
| 2024 | $8,700 |
| 2025 | $9,100 |
| 2026 | $10,200 (our estimate) |
That is a near 15% rise across two years. And 61% of companies cut a project because of an unplanned SaaS cost jump.
App counts barely moved, yet the bill still rose about 8% in a year. Existing vendors did the damage, not new purchases.
The pain shows up mostly at renewal. Vendors restructure tiers, add AI charges, then layer usage fees on top of the old base.
Our call puts the SaaS cost per employee above $10,000 for the first time in 2026. AI tiers and renewal hikes will do most of the pushing.
SaaS Pricing Transparency: Who Actually Shows A Price?
Public pricing is getting rarer as deal sizes grow. Enterprise buyers almost never see a list price.
Few large firms pay the sticker number. Most sign a custom quote instead.
Hidden costs stack up beyond the headline rate. These rarely show on the pricing page.
We build a full cost-of-ownership view before we recommend any tool. The advertised price is only the starting line, never the finish.
Shadow IT And The Hidden SaaS Bill
Plenty of software never touches the official budget. It slips in through team cards and quiet renewals.
Shadow IT is bigger than most finance teams admit. And it keeps growing.
Waste is the number we hate most at StackedReview. Half-used tools quietly drain budgets that could fund better software.
A quick audit usually finds duplicate tools doing the same job. Three chat apps. Two video tools. Nobody planned it that way.
How Buyers Are Fighting Back On Price
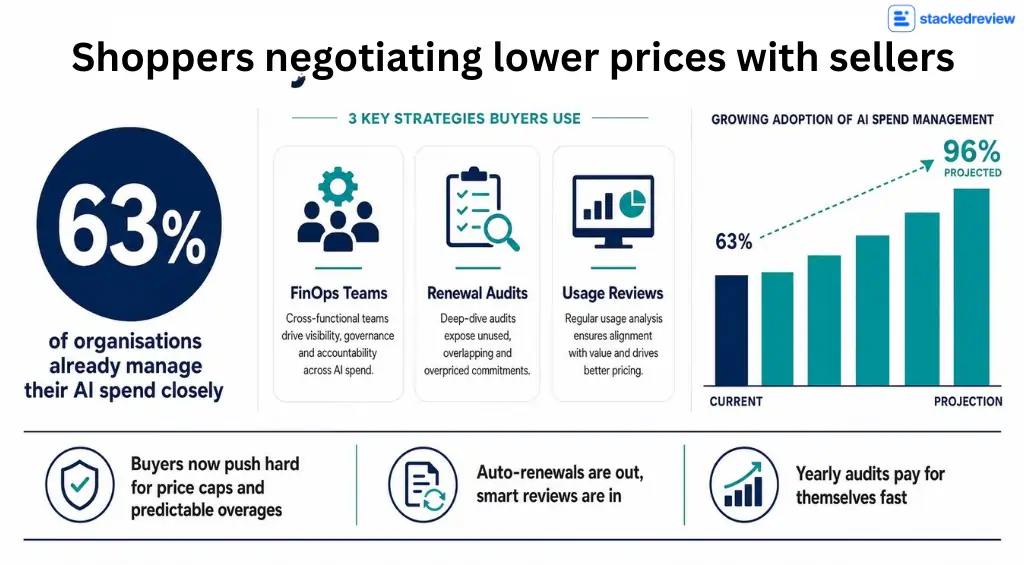
Finance teams are not sitting still. Cost control has become a full-time job at plenty of firms.
FinOps has moved from a niche role to a core one. Tracking software spend now ranks among the top three tasks for these teams.
- 63% of organisations already manage their AI spend closely
- That figure looks set to reach 96% during 2026
- Renewal reviews and usage audits are becoming routine
- Buyers now push hard for price caps and predictable overages
The old habit of auto-renewing every contract is dying. Smart teams review each renewal against actual usage.
We back this shift fully. A yearly audit of your stack often pays for itself in the first month. Cut the dead licences, and the savings are instant.
Free Trials, Freemium And What Converts In 2026
Pricing is only half the game. Turning users into payers is the other half.
The model you pick decides your free trial conversion rates before a single email goes out. The gap between models is huge.
| Model | Typical trial-to-paid rate | Sign-up volume |
|---|---|---|
| Opt-out (card required) | 25% to 50% | Low |
| Reverse trial (start in pro) | About 38% | Medium |
| Opt-in (no card) | 15% to 25% | High |
| Freemium (free to paid) | 3% to 5% | Highest |
The median self-serve rate sits near 8%. But almost nobody actually lands there.
The market splits in two. One in five products convert below 2.5%. Another quarter clear 25%.
Here is a cleaner way to picture it. Take 1,000 website visitors:
Fewer sign-ups, more payers. Card-required trials win on revenue per visitor.
We tell SaaS founders to match the model to the product. Simple viral tools suit freemium. Complex, high-value tools suit a card-required trial.
Annual Or Monthly? How SaaS Billing Splits
Billing terms matter more than they look. They shape cash flow, discounts and renewal drama.
The market splits fairly evenly between monthly and annual plans. Multi-year and usage deals take the rest.
Enterprises play a different game. They rarely pay the list price.
Big buyers treat software like capital kit. Around 74% of firms above $5 billion in revenue fold SaaS into multi-year plans.
Annual billing saves 20% to 25% on most tools we review. But only lock in yearly once a trial proves the tool sticks.
SaaS Pricing By Software Category
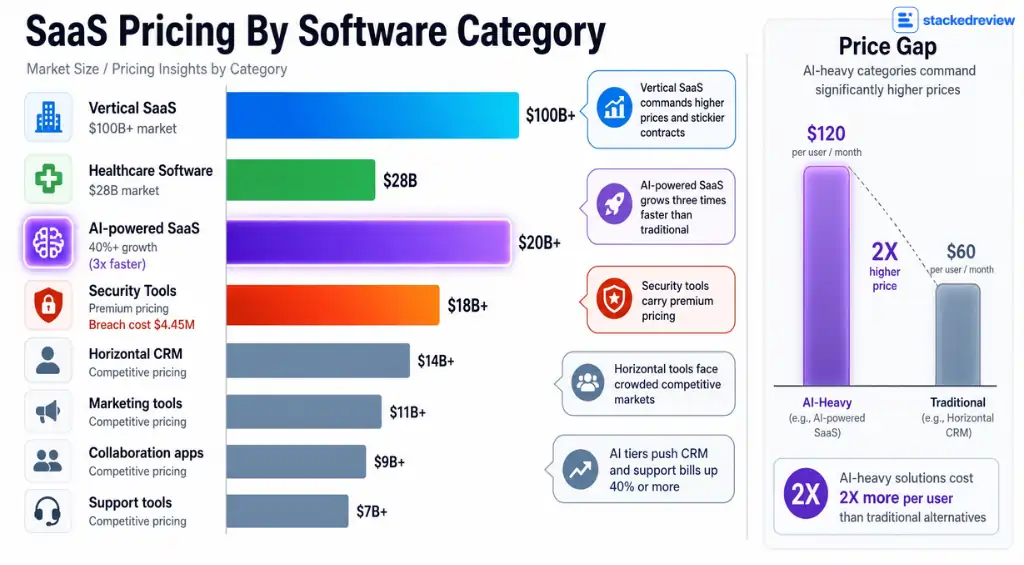
Not every category prices the same way. Some charge per seat, some per action, some per outcome.
Vertical SaaS is the fast riser here. Tools built for one industry command higher prices and stickier contracts.
Horizontal tools face the opposite pressure. CRM, marketing and collaboration apps sit in crowded markets, so pricing stays competitive.
Yet even crowded categories are climbing. AI tiers push CRM and support bills up 40% or more once switched on.
We see the widest price gaps in AI-heavy categories. Two similar tools can differ by double once you add their AI meters together.
What SaaS Buyers Actually Pay By Company Size
Budgets swing wildly with headcount. Here is what real spend looks like in 2026.
| Company size | Annual SaaS spend | What drives it |
|---|---|---|
| SMB | $50k to $500k | Fast-growing tool count |
| Mid-market | $500k to $5M | Budget-cycle timing |
| Enterprise | About $52M | Heavy negotiation and scale |
Most firms now spend 2% to 5% of annual revenue on software. For a $1 million business, that means $20,000 to $50,000 a year.
Software firms usually sit at the higher end. Service businesses tend to spend less.
Enterprise SaaS spending keeps rising even when app counts hold flat. The bill grows because vendors add AI tiers and lift renewal prices.
Regional Differences In SaaS Pricing
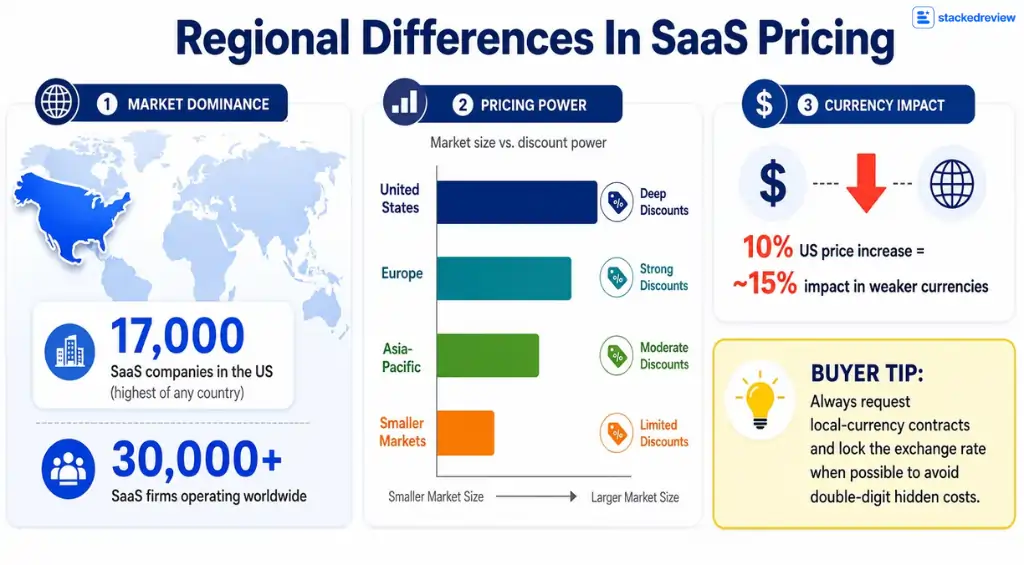
Where you buy shapes what you pay. Pricing power shifts by market and by currency.
The United States still hosts most listed SaaS vendors. That scale gives US buyers plenty of options and strong negotiating room.
Smaller markets feel price rises harder. A weak local currency turns a flat 10% US increase into something steeper on the invoice.
We always check the billing currency before we recommend a tool. Local currency or dollars, that single detail can shift your real cost by double digits.
A quick tip for buyers outside the US. Ask for a local-currency contract where you can, and lock the rate for the term.
Where StackedReview Thinks SaaS Pricing Goes Next
Time for our own calls. These SaaS Pricing Statistics point to a clear direction for 2026 and the years just after.
Hybrid becomes the default setting. We expect hybrid pricing to pass 60% adoption before the year ends. Single-metric pricing will look dated by 2027.
AI meters show up everywhere. We reckon more than 70% of platforms will charge for AI on its own by late 2026. Flat “unlimited AI” plans will keep vanishing.
Renewal hikes stay high. Our call is that annual increases hold near 10% to 12% through 2026. Buyers who never negotiate will feel it most.
Outcome pricing goes mainstream. We expect per-result billing to move from enterprise into mid-market during 2026. The vendors who can prove value will lead.
Cost per head clears $10,000. Our forecast puts average software spend per employee above $10,000 for the first time in 2026.
Credits keep spreading. We expect credit-based billing to pass 40% adoption by the end of 2026, up from 29% today.
Transparency gets worse before it gets better. Our read is that more vendors will hide enterprise pricing behind custom quotes through 2026.
These are our reads, built on years of reviewing tools and tracking real invoices. We would put money on every one of them.
FAQs Related to SaaS Pricing
What is the average SaaS price increase in 2026?
Standard renewals rise 8% to 12% a year. Aggressive vendors push 15% to 25%. Hidden fees can lift the real increase to 20% to 30%.
Which SaaS pricing model is most common in 2026?
Tiered good, better, best plans still lead at about 67%. But hybrid pricing is closing fast, on track for 61% adoption by year end.
How much do companies spend on SaaS per employee?
Spend reached about $9,100 per employee in 2025. Our estimate puts it above $10,000 in 2026, driven by AI tiers and renewal hikes.
Is usage-based pricing better than per-seat?
For growth, usually yes. Usage-based and hybrid firms report 120% and higher net revenue retention, against 110% for subscription-only peers.
What is a good free trial conversion rate?
It depends on the model. Card-required trials convert 25% to 50%. No-card trials sit at 15% to 25%. Freemium usually lands at 3% to 5%.
What These SaaS Pricing Statistics Mean For You
We have reviewed software long enough to know which numbers actually change decisions. Here is what stands out from the 2026 data.
The direction is set. Software gets pricier, smarter and harder to compare each year. At StackedReview, we keep tracking every pricing change, so your budget never meets a nasty surprise.

Sources
- Gartner: Worldwide IT Spending Forecast
- Statista: SaaS Market and Spending Data
- Zylo: 2026 SaaS Management Index
- Vertice: SaaS Inflation Index Report
- Growth Unhinged: 2026 State of B2B and AI Monetization
- BetterCloud: AI and the SaaS Industry 2026
- Chargebee: State of Subscriptions
- Precedence Research: SaaS Market Size
Affiliate Disclosure: This post may contain some affiliate links, which means we may receive a commission if you purchase something that we recommend at no additional cost for you (none whatsoever!)
Similar Posts



Verification process
Editorial standards
We’re a team of real users — not bots, not press-release copiers. Here’s exactly how we earn your trust on every single post.
We Actually Buy the Products
Every deal on this site is tested with a real purchase using our own accounts. We don’t rely on screenshots sent by vendors or press kits. If we say the discount works, we’ve clicked through checkout ourselves.
No Pay-to-Rank Policy
We never accept payment to feature or rank a deal higher. Affiliate commissions don’t influence our editorial scores — a bad deal stays ranked low regardless of commission size.
Monthly Re-Verification
Pricing changes fast. Our team re-tests every published deal at least once a month and immediately updates or removes any that have expired, changed, or been capped.
Expert Editorial Team
Our writers and editors have collectively spent 40,000+ hours hands-on with digital tools. We know what a fair price looks like — and we call out bad deals even when they’d earn us commissions.
Transparent Scoring Criteria
Every score is calculated from a public rubric: discount value, feature-to-price ratio, redemption ease, plan flexibility, and competitor comparison. No hidden weighting, ever.
Reader Feedback Loop
Thousands of readers report broken deals each month. Our team investigates every report within 24 hours and updates the page the same day a deal stops working.
Jaclyn Donaldson
Jaclyn is a content strategist at StackedReview with a passion for empowering small businesses. She specializes in dissecting social media advertising costs and hunting down the best-value deals. Her goal is to help brands stretch their budget further without compromising on results.